
Boston Condos for Sale and Apartments for Rent
Boston Condo Sales Outpace New Inventory
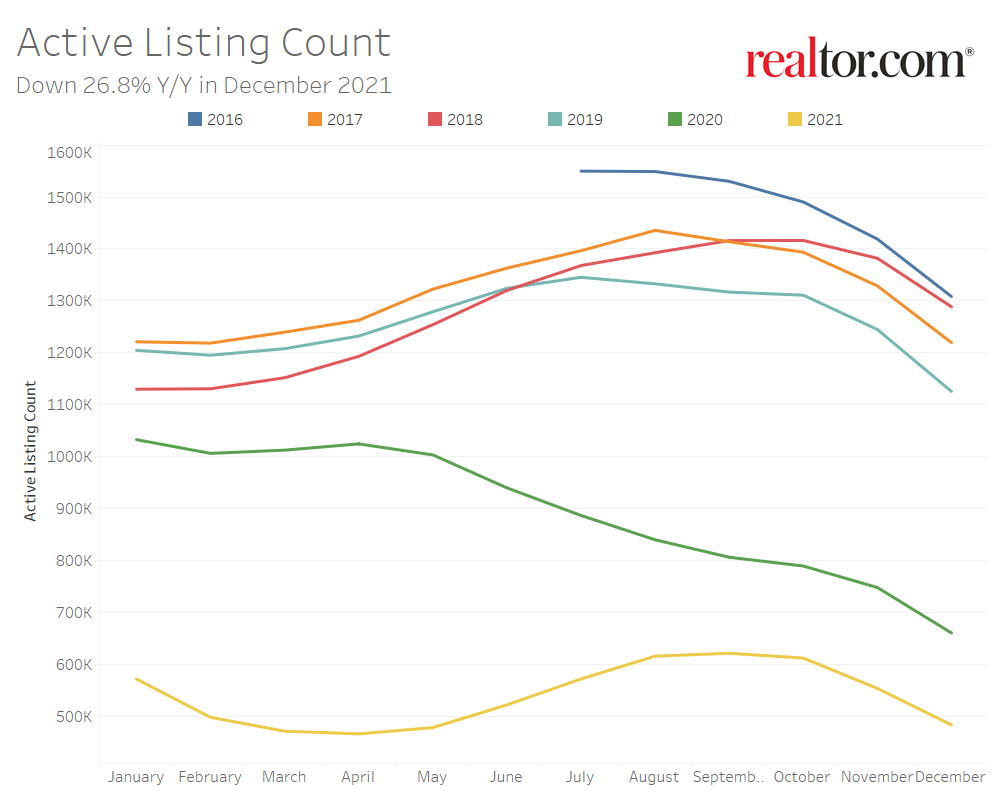
- The national inventory of active listings declined by 26.8% over last year, while the total inventory of unsold homes, including pending listings, declined by 16.1%. The inventory of active listings is down 57.1% compared to 2019.
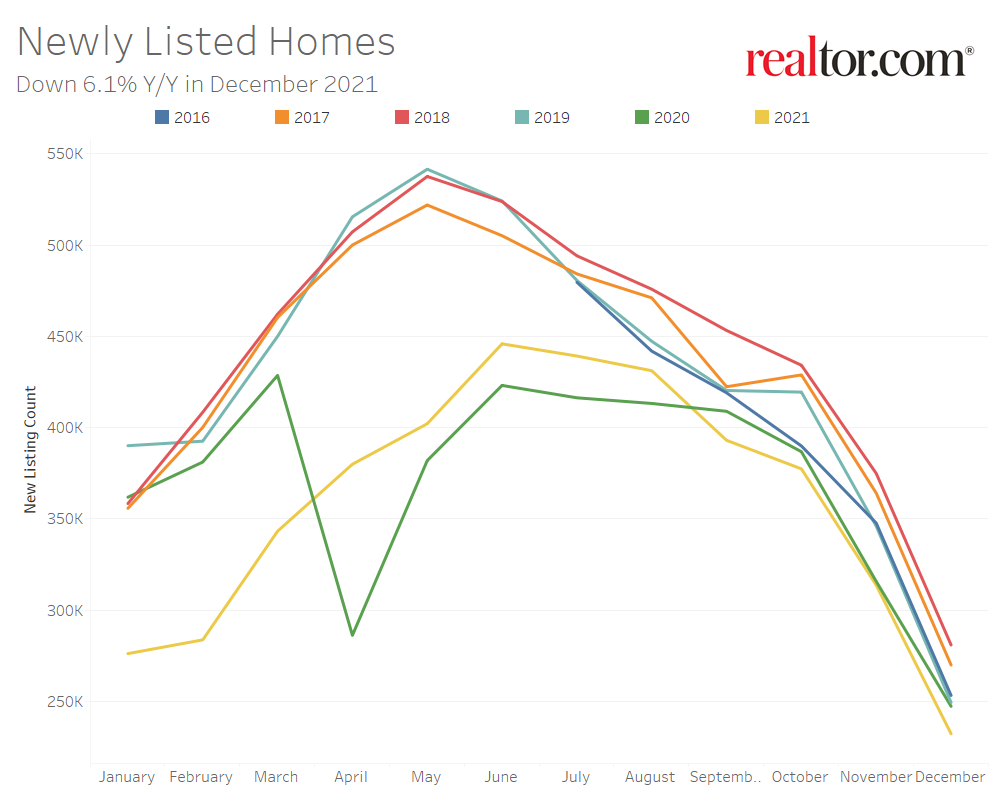
- Newly listed homes are down 6.1% nationally compared to a year ago, and down 7.6% for large metros over the past year. Sellers are still listing at rates 12.9% lower than typical 2017 to 2019 levels.
- The December national median listing price for active listings was $375,000, up 10.0% compared to last year and up 25.0% compared to 2019. In large metros, median listing prices grew by 5.4% compared to last year, on average.
- Nationally, the typical home spent 54 days on the market in December, down 11 days from the same time last year and down 26 days from 2019.
Realtor.com®’s December housing data release reveals a relatively warmer month (by housing market standards at least) than this fall, as looming interest rate hikes prompt buyers to lock-in rates in what is normally a slower time of year. The growth rate in the national median listing price increased in December, as did the gap in time on the market compared to last year, as homes spent 11 days less on the market. The decline in inventory continued to intensify and price reductions- which had been growing in share compared to last year for the past four months- ended December at the same level as last year, indicating less need to slash prices to sell homes.
The Number of Homes for Sale Continues to Shrink
Nationally, the inventory of homes actively for sale in December decreased by 26.8% over the past year, a larger rate of decline compared to the 26.0% drop in November. This marks the third month in a row where the rate of decline compared to last year has worsened. This amounted to 177,000 fewer homes actively for sale on a typical day in December compared to the previous year. The total number of unsold homes nationwide—a metric that includes active listings and listings in various stages of the selling process that are not yet sold—is down 16.1% percent from December 2020. This is a minor improvement from last month’s 16.2% decline as the inventory share of listings in pending status increased slightly, a sign that buyers are active even with fewer, fast-moving options to choose from.
In December, newly listed homes decreased by 6.1% on a year-over-year basis and sellers were still listing at rates 12.9% lower than typical of 2017 to 2019 December levels. This marks the fourth straight month of lower new seller activity than last year which has contributed to lower inventory.
The inventory of homes actively for sale in the 50 largest U.S. metros overall decreased by 26.6% over last year in December, an increase in the rate of decline compared to last month’s 24.2% decrease. Regionally, the inventory of homes in large western and southern metros are showing the largest year-over-year decline (-32.1% and -20.0%, respectively) followed by the Northeast (-24.8%) and Midwest (-16.0%).
Markets that are seeing the largest year-over-year growth in newly listed homes include Memphis (+22.0%), Pittsburgh (+10.9%), and Philadelphia (+10.8%). Markets that are still seeing a decline in newly listed homes compared to last year include San Francisco (-27.6%), Hartford (-26.6%), and Raleigh (-24.1%).
Homes Sell 11 Days Faster Than Last Year
The typical home spent 54 days on the market this December, which is 11 days less than last year and 7 days more than last month as the housing market slowed for the holidays. Despite typical seasonal slowing, homes still sold more quickly than any other December in recent history and homes even sold more quickly than during summer seasonal peaks of pre-pandemic years.
In the 50 largest U.S. metros, the typical home spent 48 days on the market, and homes spent 7 days less on the market, on average, compared to last December. Among these 50 largest metros, the time a typical property spends on the market has decreased most in large metros in the South (-9 days), followed by the West (-6 days), Midwest (-5 days), and Northeast (-5 days).
Among larger metropolitan areas, homes saw the greatest yearly decline in time spent on the market in Miami (-31 days), Orlando (-19 days), and Raleigh(-18 days). Only Hartford homes saw time on the market increase, by just five days. However, time on the market in Hartford is shorter than typical levels seen this time of year in 2019 and earlier.

Click to View Ford Realty Google Reviews
_____________________________________________________________________________________________________________________________
For several weeks in a row the number of new Boston condos coming on the market lags compared to the number of Boston condos selling or going under agreement.
Below are new Boston condo stats from the last seven days:
Number of new Boston condos listed on MLS – 17 (MLS has also has 6 other listings that were re-listed as new condos for sale)
Number of Boston condos under agreement – 52
Number of Boston condos sold – 43
On 11/17/08 MLS had 1,963 Boston condos for sale. Today MLS has 1,851 Boston condos for sale.
What gives? Why are Boston condo sales outpacing new inventory.

