
Case Shiller Index Report – Boston real estate price upward
Condos for Sale in Boston and Apartments for Rent
Case-Shiller: Boston home prices rise in March as national price growth slows

U.S. home prices continued to rise in March, but the pace of their increase slowed from previous readings, S&P Dow Jones Indices said.
Specifically, the S&P CoreLogic Case-Shiller U.S. National Home Price Index rose 3.4%, a slight decrease from the 4% annual gain measured in February. Month over month, the index rose 0.8%.
“Home-price growth continued to decelerate on an annual basis in March, even as the market experienced its strongest monthly gains so far in 2025,” said Nicholas Godec, head of fixed income tradables and commodities at S&P Dow Jones Indices.
In Boston, home prices rose 4.72% year over year and 0.74% month over month in March.
The 10-city composite index rose 4.76% on a yearly basis and 1.2% on a monthly one, while the 20-city composite rose 4.07% annually and 1.11% monthly.
“Even as year-over-year gains slowed, U.S. home prices remained at record highs, ensuring long-term homeowners retained substantial equity,” Godec said. “This spring’s price resurgence illustrated that seasonal demand and tight supply could reignite price growth, but it also underscored the housing market’s continued sensitivity to mortgage rates and affordability constraints.”
*****************************************************
Case Shiller Index Report – Boston real estate price upward
Home prices hit yet another all-time high in August, but the pace of the rise slowed from previous readings, S&P Dow Jones Indices said.
Specifically, the S&P CoreLogic Case-Shiller U.S. National Home Price Index rose 4.25% year over year but slid 0.13% month over month. In July, the rate of increase was 4.8%.
“Home-price growth is beginning to show signs of strain, recording the slowest annual gain since mortgage rates peaked in 2023,” Brian Luke, head of commodities, real and digital assets, at S&P Dow Jones Indices, said in a press release. “As students went back to school, home-price shoppers appeared less willing to push the index higher than in the summer months.
“Prices continued to decelerate for the past six months, pushing appreciation rates below their long-run average of 4.8%. After smoothing for seasonality in the data, home prices continued to reach all-time highs, for the 15th month in a row.”
In Boston, home prices posted a 5.5% year-over-year gain in August, while they slid 0.29% month over month.
The 10-city composite index rose 5.98% on a yearly basis but declined 0.36% on a monthly one, while the 20-city composite rose 5.2% annually and lost 0.32% monthly.
“Despite much-needed optimism, brought by a sharp decline in mortgage rates in August, the boost was short lived and not enough to renew homebuyers’ interest,” CoreLogic Chief Economist Selma Hepp said in a statement. “As a result, home prices continued to weaken relative to their seasonal trend, and year-over-year gains took a step back. Nevertheless, bifurcation in housing demand and price growth remained with the West and South seeing stronger slowdown in home prices and the Northeast and Midwest continuing to see home-price gains remain robust.”
Updated: Boston Real Estate Blog 2025
Click to View Google Reviews

Boston Condos for Sale
Case Shiller Index Report – Boston real estate price upward
Home prices rose again, according to the S&P CoreLogic Case-Shiller U.S. National Home Price NSA Index, which showed a 1.4% seasonally adjusted increase from July and a 19.8% increase from a year earlier.
August’s annual gain was roughly flat with the pace of July’s increase, said Craig Lazzara, managing director and global head of index investment strategy at S&P Dow Jones Indexes.
Home-price gains were once again broadly distributed, as all 20 cities rose, although in most cases at a slower rate than had been the case a month ago, Lazzara said in a press release.
The 10-city composite index rose 0.9% on a monthly basis and 18.6% on a yearly basis, while the 20-city composite gained 1.2% monthly and 19.7% annually.
In Boston, home prices were up 0.5% on a monthly basis and 17.7% on an annual one.
Phoenix, San Diego, and Tampa, Fla., led the way in residential real estate price gains among the 20 metro areas in the index.
“We have previously suggested that the strength in the U.S. housing market is being driven in part by a reaction to the COVID pandemic, as potential buyers move from urban apartments to suburban homes,” Lazzara said, adding that more data is needed to understand whether the demand surge represents an acceleration of purchases that homebuyers would have made anyway, or reflects a secular change in locational preferences.
August’s data are consistent with either explanation, Lazzara noted, adding that the increases also suggest that the rise in home price growth, while still very strong, may be beginning to decelerate.
________________________________________________________________________________________________________________________________________
Case Shiller Index Report – Boston real estate price upward
Boston Condos for Sale
Case Shiller Index Report – Boston real estate price upward
The pace of home-price increases in Boston gained steam in February, according to the S&P CoreLogic Case-Shiller U.S. National Home Price NSA Index, which showed a 0.9% increase from January and a 13.7% increase from a year earlier.
By comparison, the index rose 0.7% on a monthly basis in January.
Nationwide, the seasonally adjusted housing index rose 1.1% month over month in February and 12% year over year, up from monthly and yearly increases of 0.8% and 11.2% in January, respectively.
The national year-over-year gain is the highest recorded since February 2006, Craig Lazzara, managing director and global head of index investment strategy at S&P Dow Jones Indexes, said in a press release.
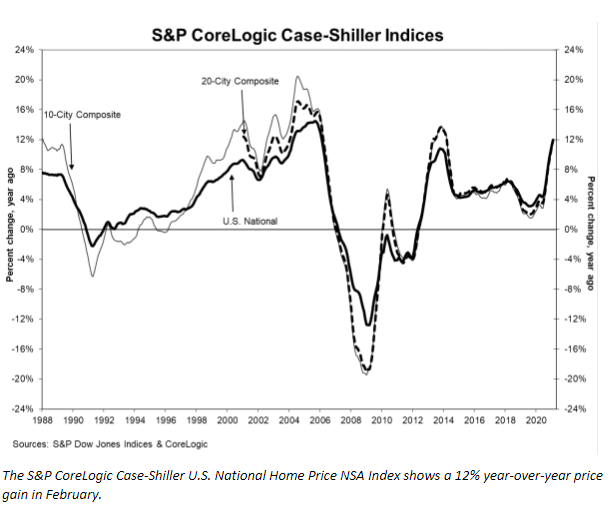
The 10-city composite index rose 1.1% on a monthly basis and 11.7% on a yearly basis, while the 20-city composite rose 1.2% monthly and 11.9% annually.
All 20 cities in the composite index posted gains, and the increases in every city are above that city’s median level, Lazzara said.
“These data remain consistent with the hypothesis that COVID has encouraged potential buyers to move from urban apartments to suburban homes,” Lazzara said. “This demand may represent buyers who accelerated purchases that would have happened anyway over the next several years. Alternatively, there may have been a secular change in preferences, leading to a permanent shift in the demand curve for housing.”
Boston Condos for Sale
________________________________________________________________________________________________________________________________________
Case Shiller Index Report – Boston real estate price upward
Case Shiller Index Report – Boston real estate price upward
- Home prices rose 4.3% annually in June, unchanged from the gain seen in May, according to the S&P CoreLogic Case-Shiller U.S. National Home Price NSA Index.
- The 10-City Composite increased 2.8% annually, down from 3% in the previous month. The 20-City Composite rose 3.5% year-over-year, down from 3.6% in the previous month
The 10-City Composite increased 2.8% annually, down from 3% in the previous month. The 20-City Composite rose 3.5% year-over-year, down from 3.6% in the previous month.
Home prices are being fueled by fierce competition among buyers
Home prices are being fueled by fierce competition among buyers for a very slim supply of homes for sale. Inventory at the end of July was down 21% annually, according to the National Association of Realtors. Unsold inventory is now at a 3.1-month supply at the current sales pace, down from 3.9 months in June and down from a 4.2-month supply in July 2019.
Boston Real Estate and the Bottom Line
Meanwhile, home sales, which plummeted in March and April due to the coronavirus pandemic, have now recovered and then some. Sales of existing homes jumped more than 20% month-to-month in June and continued to soar even higher in July when they were nearly 9% higher annually.
Boston Condos for Sale

Ford Realty Inc., Charles Street, Beacon Hill
Click Here to view: Google Ford Realty Inc Reviews

