
Forecast: Boston and national home prices moving forward
Boston Condos for Sale and Apartments for Rent
Forecast: Boston and national home prices moving forward
If the housing market feels confusing right now, you’re not alone.
Mortgage rates have risen. Home sales haven’t picked up like expected. And many buyers and sellers are wondering when things are going to feel easier or be more affordable.
The truth is: a lot changed over the first half of this year.
Back at the end of 2025, economists were forecasting a much stronger housing market for 2026. They expected mortgage rates to come down, affordability to improve more dramatically, and home sales to rebound.
But lingering inflation, economic uncertainty, and growing geopolitical tensions overseas pushed mortgage rates higher than expected. And because rates stayed elevated for longer, many buyers continued to hold off.
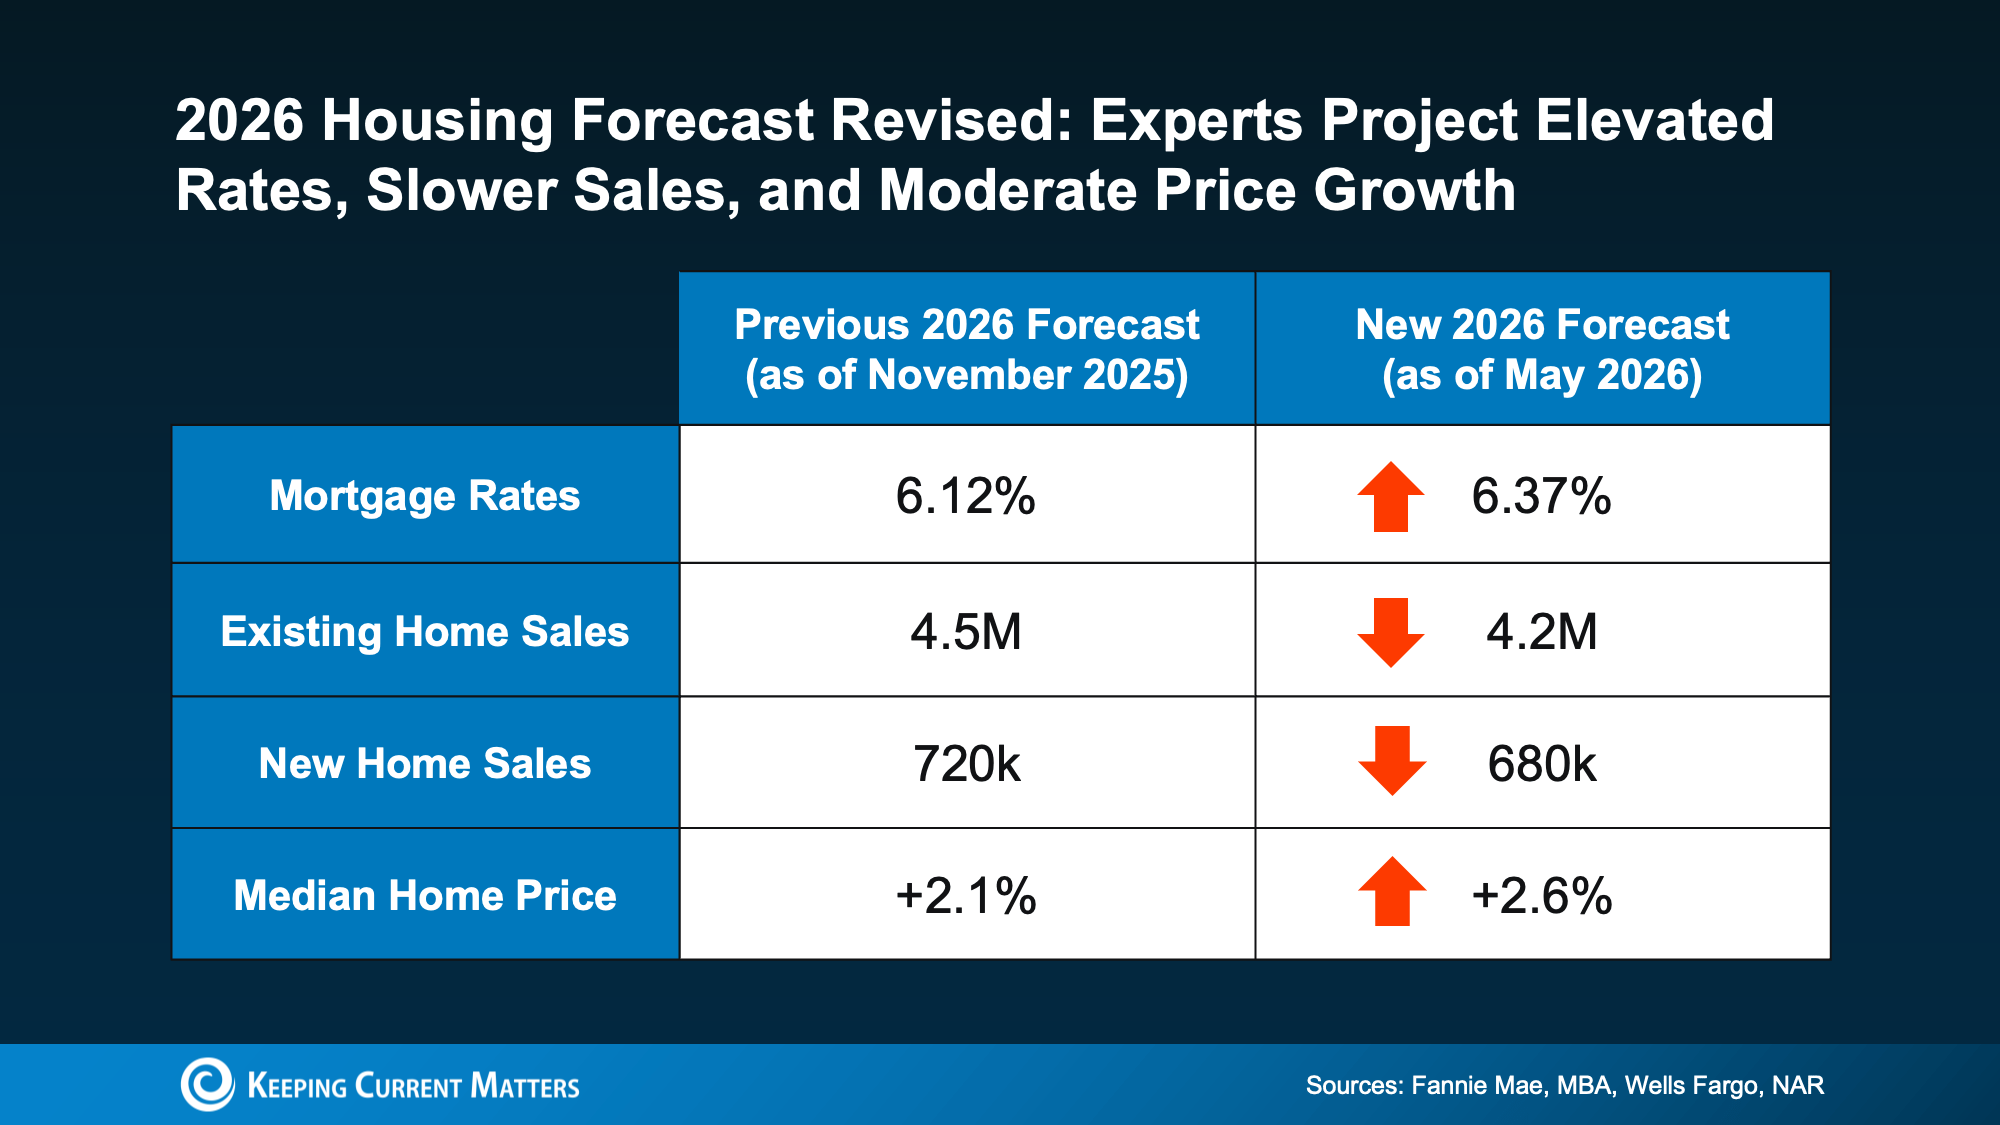
That’s why experts recently revised their housing forecasts for the rest of the year (see graph below):
So, what does this actually mean for you? Let’s break it down.
Mortgage Rates May Remain Elevated
While just about everyone wants mortgage rates to go back to the uppers 5s or low 6s we saw at the start of the year, as of right now, the experts don’t think that’s likely to happen this year.
Instead, forecasts have been updated from the low 6s they originally projected. Many industry organizations are saying rates will stay in roughly the mid 6s this year. The good news is, that’s still lower than rates were a year ago.
Of course, this is based on what we know today. If the conflict overseas comes to an end or inflation drops, this could change. But if you’re waiting for lower rates, it may not pay off in the way you expect.
Existing Home Sales Revised Lower
Back in late 2025, experts expected we’d sell an average of 4.5 million homes this year. Now? That’s dropped down a bit to 4.2 million.
That tells us something important: buyers are still hesitant because affordability remains challenging.
Higher mortgage rates have made monthly payments harder to manage, especially for first-time buyers. And that’s slowed the pace of the market compared to what was originally expected. But even though the forecast was revised down, we’re still expected to sell more homes than last year.
Once geopolitical tensions resolve and rates begin to settle down, many experts believe that group of buyers will be ready to jump back in. As Lawrence Yun, Chief Economist at NAR, explains:
“There is sizable pent-up demand that could be released into the market.”
There has already been a few glimmers of renewed hope lately. In recent months, pending homes sale have been improving month-over-month despite higher rates.
So, if you’re able to afford a home at today’s rates, it could still make sense to buy now. Because otherwise, if you wait, you’ll have more competition (and potentially fewer homes to choose from) when those others buyers jump back in.
New Home Sales Also Slowed
Builders also expected to have a stronger year. Earlier forecasts projected new home sales would top 700k in 2026. Now, economists expect we’ll be just shy of that number.
Again, mortgage rates are a major reason why.
But the upside for buyers is that builders may be even more motivated to sell. That means builder incentives, negotiation opportunities, and pricing flexibility may continue in many markets. So, if you live somewhere where there’s more new construction, this may actually be a bright spot for you.
Builders could be more ready to negotiate, and that gives you more leverage to get a better deal.
Home Prices Are Still Expected To Rise
This is one of the most important takeaways from the entire forecast. Even though sales activity is slower, on average, experts did not revise their home price forecast downward.
They still expect prices to rise nationally this year.
Why? Because while buyer demand has softened, the number of homes for sale is still relatively limited overall. That imbalance is helping support prices, even in a slower market.
Of course, conditions vary depending on where you live. Some markets are cooling more than others. But nationally, experts are still projecting steady price growth — not a major decline. And that should be a comfort whether you’re buying or selling.
Because sellers don’t want a major drop in prices. And while buyers may think they do, generally you feel better about a big purchase when it doesn’t depreciate right away.
Boston Seaport Condos for Sale and the Bottom Line
The housing market hasn’t rebounded as quickly as experts originally hoped. But that doesn’t mean it’s stalled.
Higher inflation and lingering economic uncertainty caused economists to revise their forecasts for this year. But importantly, when those two things settle down, many experts believe the market will regain its momentum.
So don’t see this revision in forecasts as a sign of trouble. See it as a temporary reaction to overall conditions and uncertainty.
Forecast: Boston and national home prices moving forward
Could we see a shift in the condos for sale in Boston market? In this video, its indicating we might be seeing a turn from a sellers market to a buyers market, at least nationally. The verdict is still out for the Boston condo for sale market in the summer of 2025.
Click Here to view: Google Ford Realty Inc Reviews for 2025
Peace be with you
Forecast: Boston and national home prices moving forward
Wondering what’s in store for the housing market this year? And more specifically, what it all means for you if you plan to buy or sell a Boston seaport condominium? The best way to get that information is to lean on the pros.
Experts are constantly updating and revising their forecasts, so here’s the latest on two of the biggest factors expected to shape the year ahead: mortgage rates and home prices.
Will Mortgage Rates Come Down?
Everyone’s keeping an eye on mortgage rates and waiting for them to come down. So, the question is really: how far and how fast? The good news is they’re projected to ease a bit in 2025. But that doesn’t mean you should expect to see a return of 3-4% mortgage rates. As Lawrence Yun, Chief Economist at the National Association of Realtors (NAR), says:
“Are we going to go back to 4%? Per my forecast, unfortunately, we will not. It’s more likely that we’ll go back to 6%.”
And the other experts agree. They’re forecasting rates could settle in the mid-to-low 6% range by the end of the year (see chart below):
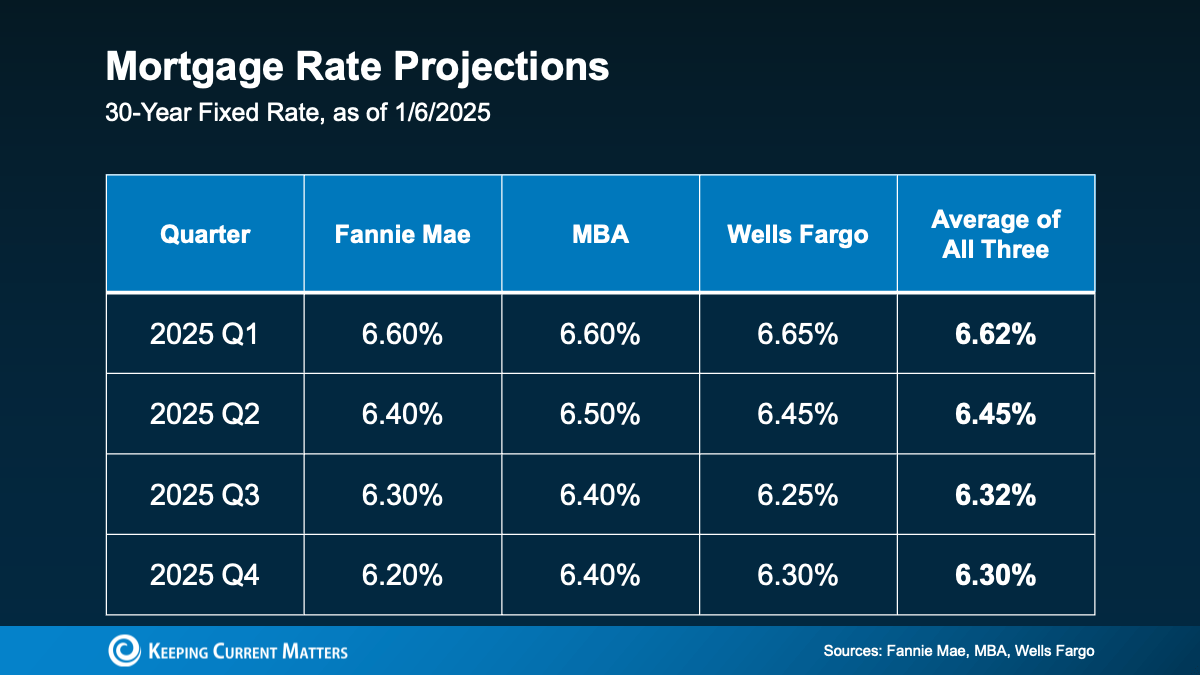 But you should remember, this will continue to change as new information becomes available. Expert forecasts are based on what they know right now. And since everything from inflation to economic drivers have an impact on where rates go from here, some ups and downs are still very likely. So, don’t get caught up in the exact numbers here and try to time the market. Instead, focus on the overall trend and on what you can actually control.
A trusted lender and a Boston condo for sale agent partner will make sure you’ve always got the latest data and the context on what it really means for you and your bottom line. With their help, you’ll see even a small decline can help bring down your future mortgage payment.
Will Home Prices Fall?
The short answer? Not likely. While mortgage rates are expected to ease, home prices are projected to keep climbing in most areas – just at a slower, more normal pace. If you average the expert forecasts together, you’ll see prices are expected to go up roughly 3% next year, with most of them hitting somewhere in the 3 to 4% range. And that’s a much more typical and sustainable rise in prices (see graph below):
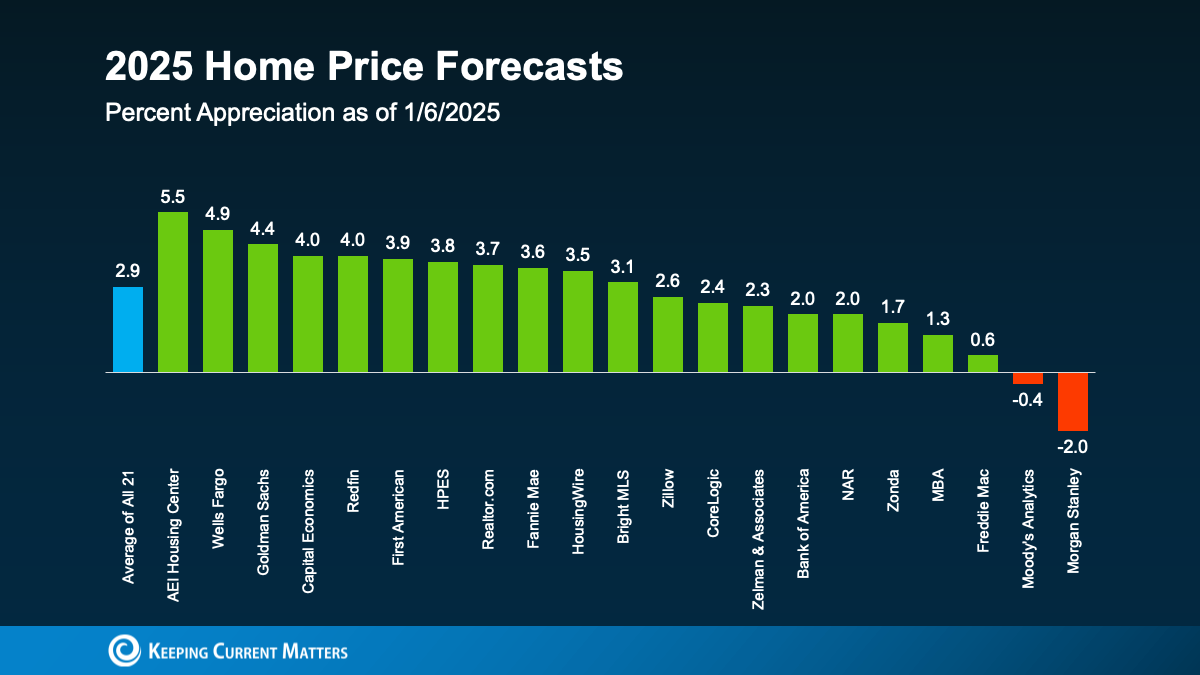 So don’t expect a sudden drop that’ll score you a big deal if you’re thinking of buying this year. While that may sound disappointing if you’re hoping prices will come down, refocus on this. It means you won’t have to deal with the steep increases we saw in recent years, and you’ll also likely see any home you do buy go up in value after you get the keys in hand. And that’s actually a good thing.
And if you’re wondering how it’s even possible prices are still rising, here’s your answer. It all comes down to supply and demand. Even though there are more homes for sale now than there were a year ago, it’s still not enough to keep up with all the buyers out there. As Redfin explains:
“Prices will rise at a pace similar to that of the second half of 2024 because we don’t expect there to be enough new inventory to meet demand.”
Keep in mind, though, the housing market is hyper-local. So, this will vary by area. Some markets will see even higher prices. And some may see prices level off or even dip a little if inventory is up in that area. In most places though, prices will continue to rise (as they usually do).
If you want to find out what’s happening where you live, you need to lean on an agent who can explain the latest trends and what they mean for your plans.
Boston Condos for Sale and the Bottom Line
The housing market is always shifting, and 2025 will be no different. With rates likely to ease a bit and prices rising at a more normal and sustainable pace, it’s all about staying informed and making a plan that works for you.
Reach out to a local real estate pro to get the scoop on what’s happening in your area and advice on how to make your next move a smart one.
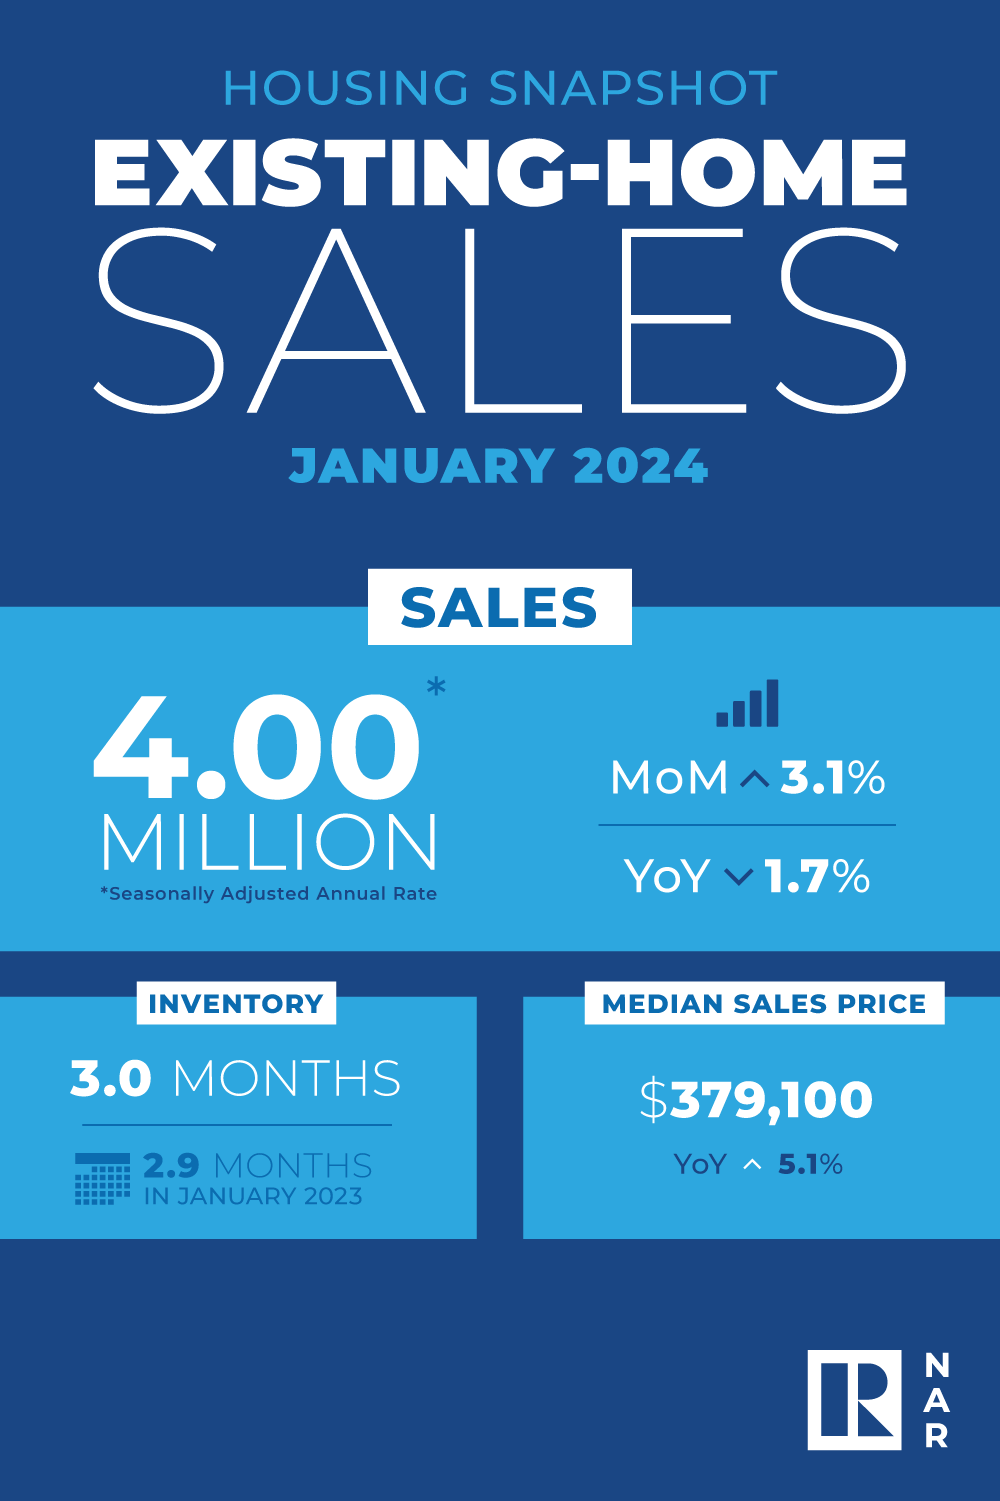 Existing-home sales jumped in January, the National Association of REALTORS® (NAR) said.
Specifically, sales rose 3.1% from December to a seasonally adjusted annual rate of 4 million. Year-over-year, sales were down 1.7% from 4.07 million in January 2023. The median existing-home price for all housing types in January was $379,100, up 5.1% from $360,800 a year before.
“While home sales remain sizably lower than a couple of years ago, January’s monthly gain is the start of more supply and demand,” NAR Chief Economist Lawrence Yun said in a press release. “Listings were modestly higher, and home buyers are taking advantage of lower mortgage rates compared to late last year.”
“Existing-home sales will continue to be constrained in the foreseeable future as the supply of homes remains tight and sellers continue to wait for lower mortgage rates,” CoreLogic Chief Economist Selma Hepp said in a news release. “All eyes are on the Fed now to cut rates this summer in order to provide relief to the buyers as well as stubborn sellers. Should they do so, existing-home sales should expect a better outlook for the remainder of the year.”
The 30-year fixed-rate mortgage averaged 6.77% as of Feb. 15, down from 6.64% a week before but up from 6.32% a year earlier, according to Freddie Mac.
Total housing inventory at the end of January stood at 1.01 million units, up 2% from December and 3.1% from the year-ago level of 980,000. Unsold inventory stood at a 3-month supply at the current sales pace, down from 3.1 months in December but up from 2.9 months in January 2023.
Properties typically remained on the market for 36 days in January, up from 29 days in December and 33 days in January 2023.
By property type, single-family home sales in January rose 3.4% month over month to an annual rate of 3.6 million. The median existing single-family home price was $383,500, up 5% on a year-over-year basis.
Existing condominium and co-op sales were flat compared to December, at an annual rate of 400,000. The median existing condo price was $339,400, up 5.7% from January 2023.
______________________
Many people have questions about Boston condo prices right now. How much have prices risen over the past 12 months? What’s happening with home values right now? What’s projected for next year? Here’s a look at the answers to all three of these questions.
How much have home values appreciated over the last 12 months?
According to the latest Home Price Index from CoreLogic, home values have increased by 18.1% compared to this time last year. Additionally, prices have gone up at an accelerated pace for each of the last eight months (see graph below): The increase in the rate of appreciation that’s shown by CoreLogic coincides with data from the other two main home price indices: the FHFA Home Price Index and the S&P Case Shiller Index.
The last year has shown tremendous home price appreciation, which is resulting in a major gain in wealth for homeowners through rising equity.
What’s happening with home prices right now?
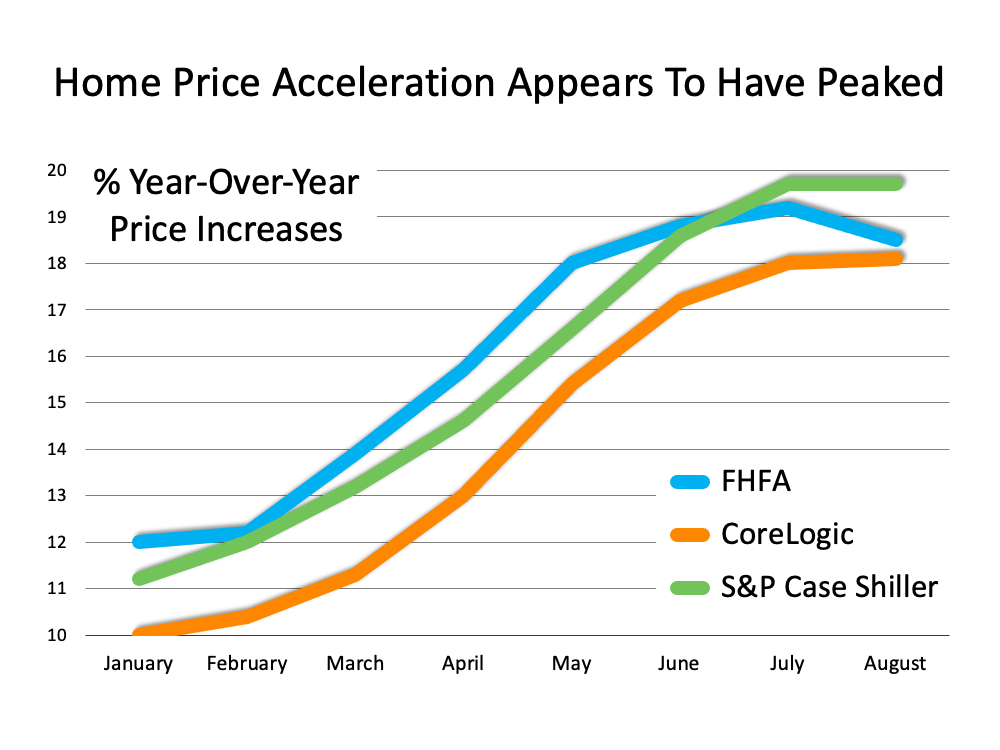 Year-over-year appreciation is still close to 20%, but it’s clearly plateauing at that rate. Many experts believe it will drop below 15% by the end of the year.
Keep in mind, that doesn’t mean home values will depreciate. It means the rate of appreciation will slow, but above the 25-year average of 5.1%.
All three indices mentioned above also show that while appreciation is in the high double digits right now, that price acceleration is beginning to level off (see graph below):
What about real estate prices next year?
The recent surge in prices is the result of heavy buyer demand and a shortage of homes available for sale. Most experts believe that as more housing inventory comes to market (both new construction and existing homes), the supply and demand for housing will come more into balance. That balance will bring a lower rate of appreciation in 2022. Here’s a look at home price forecasts from six major entities, and they all project future appreciation:
- Fannie Mae
- Freddie Mac
- Mortgage Bankers Association
- Home Price Expectation Survey
- Zelman & Associates
- National Association of Realtors
 While the projected rate of appreciation varies among the experts, due to things like supply chain challenges, virus variants, and more, it’s clear that home values will continue to appreciate next year.
Boston Condos and the Bottom Line
There have been historic levels of home price appreciation over the last year. That pace will slow as we finish 2021 and enter into 2022. Prices will still rise in value, just at a much more moderate pace, which is good news for the housing market.
_______________________________________________________________________________________________________________________________________
Boston Condos for sale
Forecast: Boston and national home prices moving forward
Homebuyers in the Boston area should brace themselves — again — amid expectations that the residential real estate market could jump 15% next year — on top of a previous one-year increase of 13.1%, according to a new study by Porch.
A dwindling supply is being blamed for skyrocketing home prices in the Bay State, where the median price clocks in at $573,182.
Currently, Boston is ranked No. 33 out of 51 large metro real estate markets expected to grow the most in the next year. And Boston is not the only Massachusetts city to feature in these new price predictions. Worcester ranks at No. 29 among midsized metros with a projected growth of 16.1% and Springfield ranks No. 41 with a projected growth of 14.2%. Among smaller metro areas, Barnstable ranks at No. 5 with 24.8% projected growth.
With a median home price of nearly $459,000, Austin, Texas, tops the list at No. 1. Home prices there are anticipated to rise by a staggering 37%.
Boston Condos for sale

______________________________________________________________________________________________________________________
The following information is from Zillow study:
Rate of homes going under contract slows slightly, but time on market still short
- Buyers are still extremely keen to purchase houses, with newly pending sales up 21.8% compared to last year. However, the frenzied activity of the summer is showing signs of the typical fall slowdown, dropping 2.8% compared to a month ago and down 1% since the week prior.
- Typical time-on-market for listings stayed steady at 13 days, which is 14 days quicker than last year. Among the 50 largest U.S. markets, Cincinnati and Columbus, Ohio, shared the shortest typical time on market at four days to pending. Nashville posted the longest typical time on market at 33 days, while New York and Virginia Beach both marked 32.
Inventory shortage falls further
- Total inventory dropped even further in a steady decline that began the first week of June. For-sale listings fell an enormous 34.6% below this week last year; the largest year-over-year deficit seen since Zillow’s weekly stats began in 2019.
- There were 13.6% fewer new listings last week than at this point last year.
Prices soar amid strong demand and low supply
- The median sale price continued its meteoric rise to $284,000 as of the week ending Aug. 8, 8.7% higher than the previous year and the largest year-over-year increase seen since at least the beginning of 2019. Sale prices were up 2% over the month prior.
- The median list price rose to $345,000, a full 10% over last year but just 0.1% higher than a month prior.
New home sales astound
- New home sales have been particularly robust, even within this astounding buying season. The annualized pace of new home sales in August exceeded 1 million homes — a benchmark unseen since 2006.
Metropolitan Area* | Newly | Newly | Median | Total | New | New | Median | Median |
United States | 21.8% | -1.0% | 13 | -34.6% | -13.6% | 4.2% | 284000 | 8.7% |
New York/Newark, NY/NJ | 60.4% | 0.8% | 32 | -20.1% | -11.5% | -0.8% | 445000 | 2.7% |
Los Angeles, CA | 8.1% | 0.7% | 12 | -24.9% | 8.4% | 3.4% | 713375 | 7.7% |
Chicago, IL | 38.2% | -2.2% | 13 | -28.5% | -1.0% | 8.7% | 264500 | 7.3% |
Dallas-Fort Worth, TX | 30.6% | -0.3% | 23 | -31.8% | -24.4% | 1.4% | 303812 | 9.1% |
Philadelphia, PA | 37.1% | 3.3% | 9 | -37.3% | -5.8% | 10.5% | 279000 | 5.3% |
Houston, TX | 25.4% | -0.2% | 17 | -29.1% | -17.3% | 8.2% | 271529 | 9.9% |
Washington, DC | 21.8% | 2.9% | 7 | -34.4% | -1.6% | 3.6% | 459431 | 8.4% |
Miami-Fort Lauderdale, FL | 40.1% | 2.6% | 27 | -13.4% | -12.3% | 4.6% | 329750 | 12.4% |
Atlanta, GA | 15.8% | -3.3% | 14 | -30.6% | -22.0% | 6.3% | 283850 | 10.4% |
Boston, MA | 6.3% | 2.4% | 8 | -30.5% | -18.9% | 1.6% | 522500 | 8.1% |
San Francisco, CA | 34.4% | -1.6% | 12 | -4.3% | 3.1% | 24.0% | 896500 | 12.1% |
Detroit, MI | 41.8% | -3.3% | 8 | -38.1% | -14.9% | 12.1% | 222975 | 11.7% |
Riverside, CA | 12.0% | -1.4% | 9 | -48.1% | 6.6% | 6.0% | 411250 | 10.3% |
Phoenix, AZ | 18.9% | 3.1% | 11 | -21.6% | 0.0% | 11.9% | 322500 | 11.9% |
Seattle, WA | 20.5% | -2.3% | 6 | -32.2% | -6.3% | -2.8% | 535525 | 11.1% |
Minneapolis-St. Paul, MN | 31.2% | 1.1% | 17 | -27.1% | 3.9% | -0.3% | 311625 | 9.3% |
San Diego, CA | 8 | -38.2% | 2.5% | -1.7% | 635188 | 8.9% | ||
St. Louis, MO | 16.8% | -1.6% | 6 | -38.4% | -11.2% | 14.7% | 217912 | 10.7% |
Tampa, FL | 8 | -34.8% | -16.4% | -4.4% | 258409 | 9.5% | ||
Baltimore, MD | 17.2% | 6.6% | 12 | -44.8% | -12.7% | 9.3% | 317500 | 0.8% |
Denver, CO | 25.8% | -1.5% | 6 | -34.2% | 16.2% | 21.8% | 462881 | 6.5% |
Pittsburgh, PA | 52.3% | 1.3% | 9 | -27.2% | -2.3% | 11.8% | 199499 | 7.7% |
Portland, OR | 21.9% | -5.5% | 6 | -37.0% | -28.4% | -1.3% | 440225 | 8.6% |
Charlotte, NC | -1.8% | -1.1% | 6 | -42.9% | -19.2% | 14.2% | 286500 | 8.5% |
Sacramento, CA | 18.3% | -1.5% | 7 | -44.1% | 0.3% | 1.6% | 452875 | 8.1% |
San Antonio, TX | 34.4% | 0.6% | 27 | -25.7% | -23.1% | 11.0% | 252812 | 8.2% |
Orlando, FL | 12 | -17.0% | -3.0% | 11.4% | 282562 | 7.8% | ||
Cincinnati, OH | 12.0% | 0.7% | 4 | -39.1% | -3.7% | 21.9% | 212125 | 11.8% |
Cleveland, OH | 70.9% | 0.3% | 18 | -39.8% | -0.8% | -2.5% | 175350 | 9.6% |
Kansas City, MO | 15.4% | -0.6% | 5 | -43.7% | -4.9% | 22.8% | 259250 | 12.7% |
Las Vegas, NV | 18.5% | -1.4% | 15 | -23.3% | 8.3% | 2.3% | 304750 | -0.1% |
Columbus, OH | 18.6% | 0.6% | 4 | -40.1% | -11.4% | 10.4% | 240500 | 16.1% |
Indianapolis, IN | 14.0% | 2.4% | 5 | -41.0% | 6.7% | 31.9% | 222625 | 8.4% |
San Jose, CA | -9.7% | -3.5% | 15 | -20.2% | 20.3% | 18.1% | 1139375 | 8.6% |
Austin, TX | 29.2% | 2.0% | 8 | -37.0% | -2.9% | 41.5% | 357978 | 12.4% |
Virginia Beach, VA | 32 | -40.7% | -1.3% | 0.7% | 276912 | 8.1% | ||
Nashville, TN | 33 | -24.0% | -36.9% | 17.5% | 317850 | 5.1% | ||
Providence, RI | -2.9% | 3.7% | 13 | -38.3% | -24.4% | 4.2% | 318600 | 5.4% |
Milwaukee, WI | 28 | -6.5% | -6.2% | 31.2% | 207475 | 6.9% | ||
Jacksonville, FL | 43.2% | 1.4% | 14 | -36.7% | -17.0% | 0.2% | 268362 | 1.3% |
Memphis, TN | 33.9% | 1.1% | 7 | -45.4% | -20.2% | 6.1% | 209212 | 7.0% |
Oklahoma City, OK | 20.4% | -4.6% | 10 | -35.5% | -6.2% | 24.8% | 205750 | 12.5% |
Louisville, KY | 3.0% | -0.6% | 5 | -43.9% | -8.3% | 1.3% | 217812 | 9.0% |
Hartford, CT | 49.6% | -1.3% | 10 | -41.5% | 5.7% | 10.9% | 258800 | 7.8% |
Richmond, VA | 6 | -39.9% | -10.0% | 9.3% | 284688 | 7.9% | ||
New Orleans, LA | 4.1% | -1.7% | 17 | -44.0% | -20.8% | -2.0% | 232875 | 6.6% |
Buffalo, NY | 18.7% | -2.5% | 10 | -36.2% | -8.6% | -0.3% | 189850 | 9.7% |
Raleigh, NC | 15.0% | 1.3% | 5 | -41.4% | -25.7% | 13.1% | 312812 | 5.8% |
Birmingham, AL | 43.2% | 0.9% | 8 | -35.4% | 9.3% | 22.3% | 224942 | 4.8% |
salt Lake City, UTS | 6 | -45.5% | -33.7% | 29.8% | 381916 | 11.2% |
And it’s also worth noting: This is Massachusetts. Our housing market here has been crazy due to COVID, and there’s simply not enough new housing here to meet demand. That means … well, you figure it out.
Back to Boston condos for sale homepage
Contact me to find out more about this property or to set up an appointment to see it.
SEARCH FOR CONDOS FOR SALE AND RENTALS
For more information please contact one of our on-call agents at 617-595-3712.
Updated: 2024

