
Lets inspect the Boston condo inventory numbers
Boston Condos for Sale and Apartments for Rent
Lets inspect the Boston condo inventory numbers
Want to know two reasons this spring might finally be your time to buy a Boston condo? Inventory has grown and sellers may be more willing to negotiate as a result. That means you’ve got more options and more power than buyers have had in years. Let’s break it down.
1. You Have More Homes To Choose From
The number of Back Bay condos for sale this March is on the rise – and that’s great news for your home search. The graph below uses the latest data from Realtor.com to show the supply of homes on the market has grown by 27.5% in just the last year:
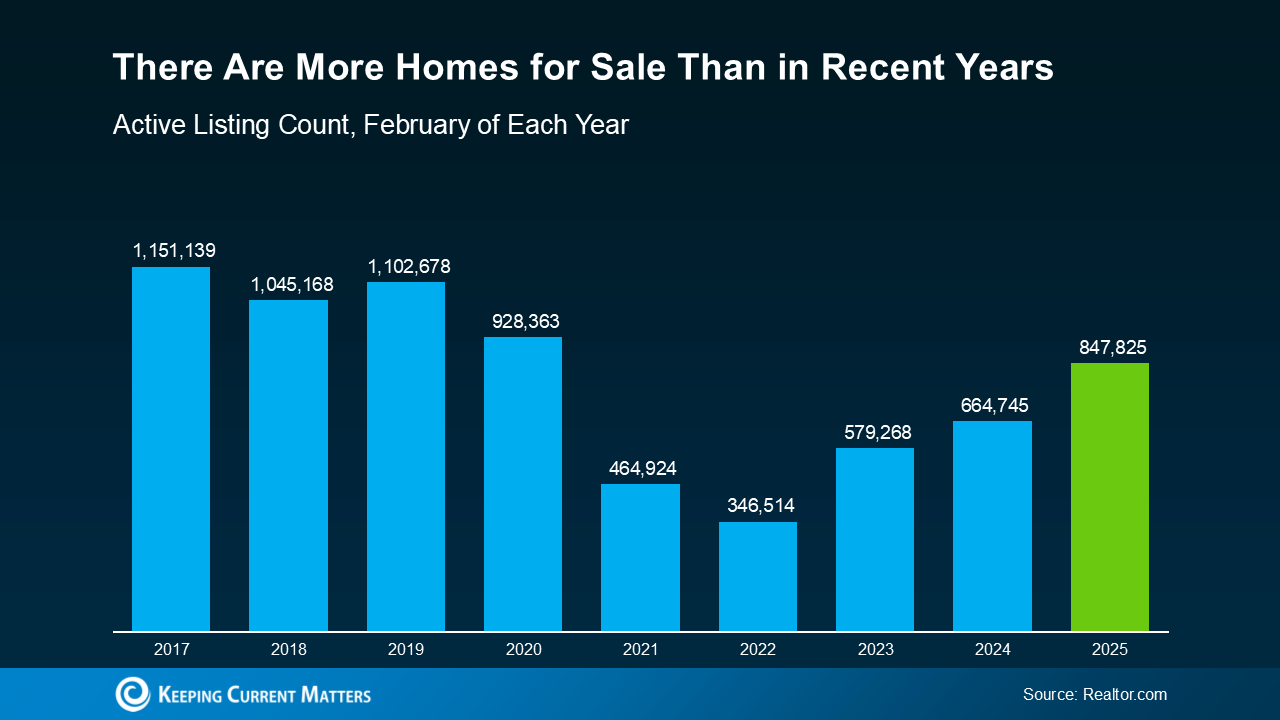 More Back Bay condos for you to search is a good thing – and experts also say that inventory is projected to continue rising this year, which is even better. It means it should be easier to find something that checks your most important boxes. But that’s not all this does for you. Danielle Hale, Chief Economist at Realtor.com, explains some of the other perks of more inventory, beyond just having more homes to consider:
“Buyers will not only have more home options . . . but they are also likely to find somewhat lower asking prices and more time to make decisions – all buyer-friendly factors as we inch closer to the busy homebuying season.”
2. You May Find Sellers Are Doing Price Cuts
Now that buyers have more options, some homes are sitting on the market a little longer – especially those that were priced too high from the start. And the result is more sellers are having to drop their prices to draw buyers back in. Just take a look at the numbers.
According to Realtor.com, the number of listings with price reductions has gone up compared to the last few years (see graph below):
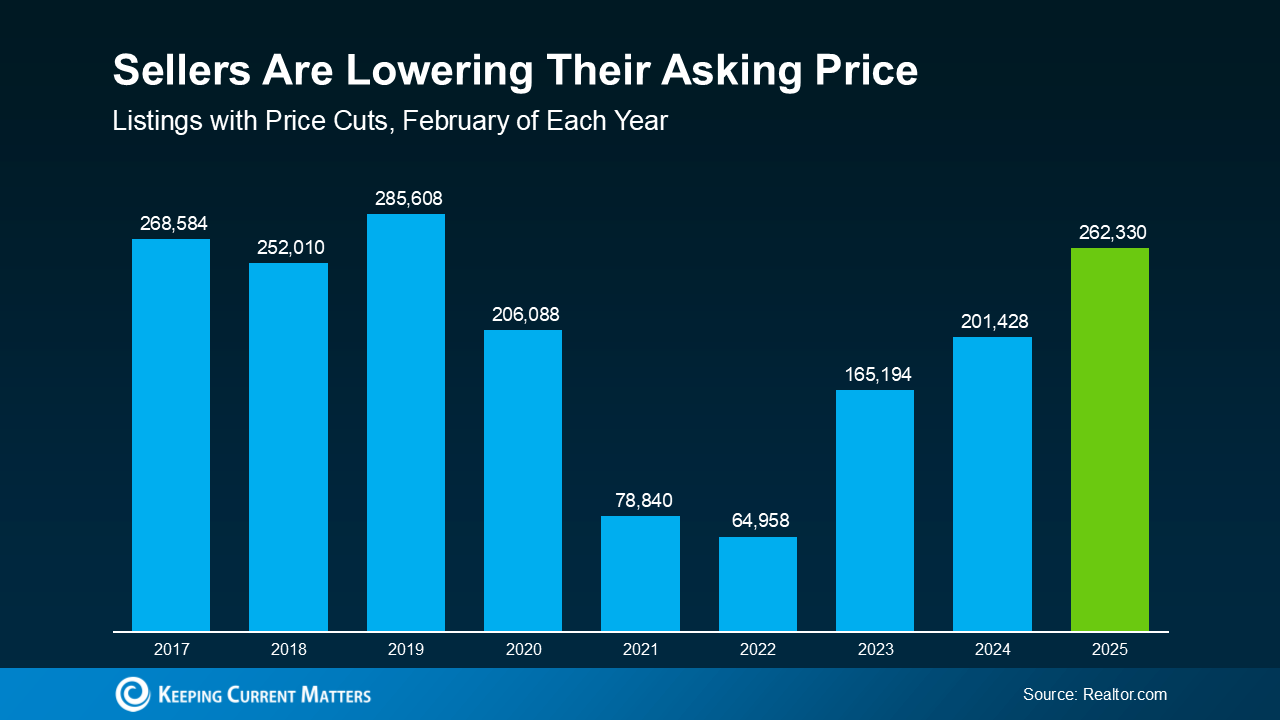 This is a sign sellers are more willing to compromise today. If you look back to more normal years in the market (2017–2019), you’ll see that the number of price cuts happening today is much closer to what’s typical – and for most buyers, that’s a big relief.
What does that mean for you? It could give you a better chance to negotiate – whether that’s on price, closing costs, or even repairs. While not every seller will adjust their price, more of them are willing to do it – giving you more leverage than buyers have in quite a while.
Boston Condos and the Bottom Line
If you’ve been on the sidelines, waiting for the right time to buy, this spring could be the opening you’ve been hoping for.
Of course, every market is different, and working with a local expert can help you work through your options. If you want to talk about what’s happening in your area or get started on your home search, connect with a local real estate agent.
Boston tops list of markets with fewest home listings
Boston has the fewest home condos for sale nationally, in a market steeped with competition driven by low inventory.
A new report from Zillow found Boston is the No. 1 market for year-over-year declines in housing supply. Boston property listings are down 17.2% from 2023, followed by Pittsburgh, which was down 14.2%, and Washington, D.C., which was down 13.6%, according to Zillow’s March Housing Market Report.
Nationally in March, new listings rose 15.5% from February and were up 3.7% from 2023.
New listings were down 25.4% from pre-pandemic levels
Zillow’s report found that depending on their locations, homebuyers are encountering very different scenarios when it comes to competition in the current market – all driven by the same factor: inventory.
And that’s not all.
Typical U.S. home values are up 42.4% compared to pre-pandemic levels, as is the typical monthly mortgage payment, which is up nearly 108%, more than double pre-pandemic payments. Annually, the typical mortgage payment is up 7.1% from last year.
Boston had one of the highest annual home-price gains in March.
Zillow found home values were up from last year in 47 of the 50 largest metros. Annual price gains were highest in Hartford, Connecticut (12.7%), San Diego (11.8%), San Jose, California (11.2%), Boston (9.5%) and Los Angeles (9.3%).
******************************************************************
Lets inspect the Boston condo inventory numbers
Boston Condos for Sale and Apartments for Rent
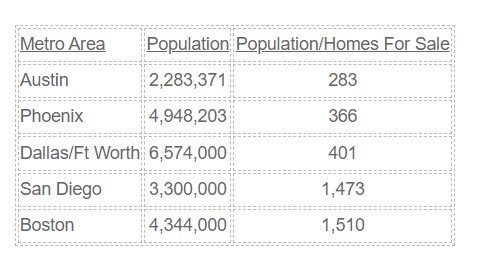
Boston condo inventory compared to population
_______________________________________________________________________________________________
Lets inspect the Boston condo inventory numbers
The number of homes available to buyers climbed 18.7% in June, the sharpest year-over-year increase in the history of the Realtor.com Monthly Housing Trends Report.
While active listings increased, so did prices. The median home price in the report increased 16.9% to $450,000, compared to June 2021.
Boston Condo for Sale Inventory Lacking
In the Boston-Cambridge-Newton region, the median listing price increased 8.6% year over year to $759,000, while active listings increased by just 0.4%, well behind the national trend.
Compared to June 2021, active inventory increased in 40 of the 50 largest U.S. metros, led by Austin, Texas (+144.5%), Phoenix (+113.2%) and Raleigh, N.C. (+111.7%).
“While we anticipate that more inventory will eventually cool the feverish pace of competition, the typical buyer has yet to see meaningful relief from quickly selling homes…”
Updated: Boston Real Estate Blog 2024
Click to View Google Reviews

_______________________________________________________________________________________________
Lets inspect the Boston condo inventory numbers
Today, I would like to have a blog post regarding Boston condo inventory. My purpose, to find out if certain price range condos have a shortage of inventory or a glut. But first, we need to set the ground rules. How would you like to see the breakdown of the inventory. For example should I start $200,000 – $300,000 and move up to $301,000 – $400,000 ect…
Second option could be to group the price inventory on a larger spread. For example:
$300,000 – Less
$301, 000 – $600,000
etc….
Looking for ideas?
If you would like to see today’s new Boston condo inventory click on our new and improved Boston real estate web site

