
Boston Condos for Sale and Rent
Massachusetts housing government data
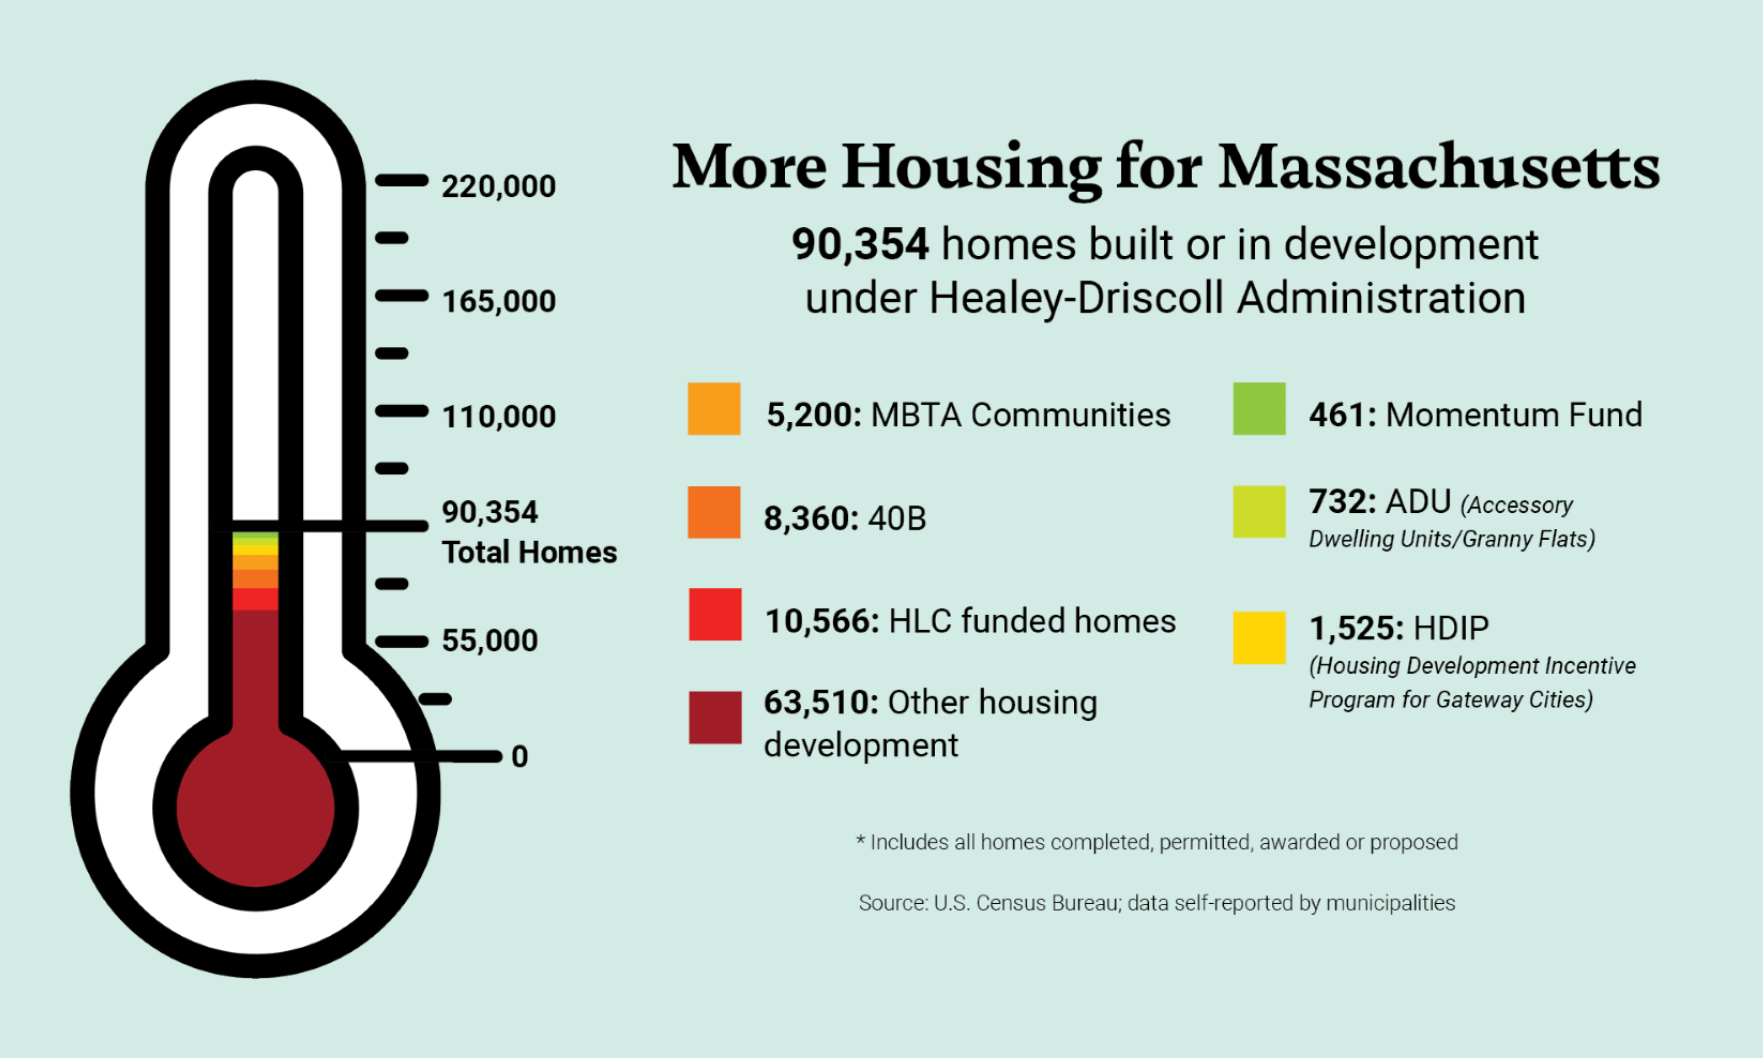
Image courtesy of Mass.gov
Since being signed by Massachusetts Governor Maura Healey in 2024, the Affordable Homes Act has kickstarted development of over 90,000 units of housing in the Commonwealth, according to data from the U.S. Census Bureau.
Several initiatives under the Act have contributed to the housing supply:
- The Momentum Fund, introduced in the Act, leverages low-cost capital and partners with private developers to incentivize already permitted housing construction. So far, it’s financed over 460 units statewide.
- MBTA multifamily zoning changes prompted communities across Massachusetts to begin development of 5,200 housing units.
- EOHLC-funded projects and permits and approvals for accessory dwelling units will add thousands more homes to Massachusetts’ supply.
“The housing shortage takes away people’s power to choose where they want to live, which is why we’ve acted urgently to implement the Affordable Homes Act, build more housing and give choice back to renters and homebuyers,” said Secretary of Housing and Livable Communities Ed Augustus in a press release.
Massachusetts housing government data
To the Massachusetts real estate market, the following data below is compiled of current and historical data from the U.S. Census Bureau and the Department of Housing and Urban Development. The data will cover homeownership rates, vacancies, foreclosures, mortgages, new housing construction, and manufacturing, as well as housing characteristics such as the median age, square feet, and the number of rooms for homes in Massachusetts.
Massachusetts
– Homeownership rate: 61.4%
– Homeowner vacancy rate: 0.8%
– Rental vacancy rate: 2.1%
– Occupied housing units: 2,650,680
— Owner-occupied housing units: 1,647,747, renter-occupied housing units: 1,002,933
— Year homes were built: 2014 or later (3.0%), 2010 to 2013 (1.7%), 2000 to 2009 (6.9%), 1980 to 1999 (18.4%), 1960 to 1979 (22.2%), 1940 to 1959 (16.7%), 1939 or earlier (31.1%)
— Number of bedrooms: no bedroom (2.4%), 1 bedroom (14.1%), 2 or 3 bedrooms (62.3%), 4 or more bedrooms (21.3%)
— Type of heating used: utility gas (52.3%), bottled, tank, or LP gas (3.7%), electricity (16.9%), fuel oil, kerosene, etc. (24.4%), coal or coke (0.1%), all other fuels (2.2%), no fuel used (0.5%)
– New building permits: 17,025 ($4,761,486 value)
– Manufactured homes shipped to state: 115 (average sales price: $155,100)

Massachusetts housing government data
Boston Condos for Sale and Rent
Massachusetts housing government data
Image courtesy of Mass.gov
Since being signed by Massachusetts Governor Maura Healey in 2024, the Affordable Homes Act has kickstarted development of over 90,000 units of housing in the Commonwealth, according to data from the U.S. Census Bureau.
Several initiatives under the Act have contributed to the housing supply:
- The Momentum Fund, introduced in the Act, leverages low-cost capital and partners with private developers to incentivize already permitted housing construction. So far, it’s financed over 460 units statewide.
- MBTA multifamily zoning changes prompted communities across Massachusetts to begin development of 5,200 housing units.
- EOHLC-funded projects and permits and approvals for accessory dwelling units will add thousands more homes to Massachusetts’ supply.
“The housing shortage takes away people’s power to choose where they want to live, which is why we’ve acted urgently to implement the Affordable Homes Act, build more housing and give choice back to renters and homebuyers,” said Secretary of Housing and Livable Communities Ed Augustus in a press release.
Massachusetts housing government data
To the Massachusetts real estate market, the following data below is compiled of current and historical data from the U.S. Census Bureau and the Department of Housing and Urban Development. The data will cover homeownership rates, vacancies, foreclosures, mortgages, new housing construction, and manufacturing, as well as housing characteristics such as the median age, square feet, and the number of rooms for homes in Massachusetts.
Massachusetts
– Homeownership rate: 61.4%
– Homeowner vacancy rate: 0.8%
– Rental vacancy rate: 2.1%
– Occupied housing units: 2,650,680
— Owner-occupied housing units: 1,647,747, renter-occupied housing units: 1,002,933
— Year homes were built: 2014 or later (3.0%), 2010 to 2013 (1.7%), 2000 to 2009 (6.9%), 1980 to 1999 (18.4%), 1960 to 1979 (22.2%), 1940 to 1959 (16.7%), 1939 or earlier (31.1%)
— Number of bedrooms: no bedroom (2.4%), 1 bedroom (14.1%), 2 or 3 bedrooms (62.3%), 4 or more bedrooms (21.3%)
— Type of heating used: utility gas (52.3%), bottled, tank, or LP gas (3.7%), electricity (16.9%), fuel oil, kerosene, etc. (24.4%), coal or coke (0.1%), all other fuels (2.2%), no fuel used (0.5%)
– New building permits: 17,025 ($4,761,486 value)
– Manufactured homes shipped to state: 115 (average sales price: $155,100)

