
Home Sales Report
Boston Condos for Sale and Apartments for Rent
Home Sales Report
Home selling suffered a setback in August, both on a monthly and annual basis, as surging mortgage rates kept more would-be buyers on the sidelines at the end of summer.
Existing-home sales decreased to a seasonally adjusted annual rate of 3.98 million, down 2% from July and 1.2% from a year ago, the National Association of Realtors®thesehold was in June 2025.
Falling behind the year-ago pace, the August sreported Thursday. The last time sales dipped below the 4 million ales snapped a four-month streak of annual gains.
“Mortgage rates and home sales move in opposite directions, so it’s not surprising to see a mild dip in home buying activity due to high mortgage rates,” says NAR Chief Economist Lawrence Yun. “Still, home prices are rising, and existing home sales are actually up 1.6% year-to-date through the first eight months of the year.”
The 30-year fixed-rate mortgage climbed to 6.71% on Sept. 3, its highest level in more than a year, according to Freddie Mac, as renewed inflation fears triggered a large-scale bond sell-off.
At the regional level, month-over-month sales held steady in the West but slumped in the Northeast, Midwest and South. Meanwhile, annual sales declined everywhere except the South, where they remained flat.
Yun points out that despite the persistently high borrowing costs cooling sales, homebuying demand is being propped up by rising wages, which increased 3.2% in August, according to the latest better-than-expected jobs report.
Northeast markets drive overall US home-price growth in June
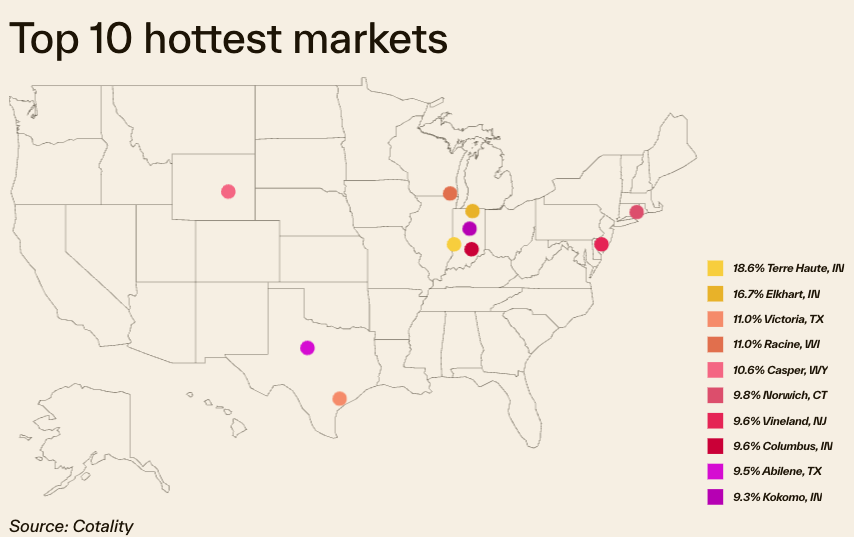
National home-price growth remained “modest but accelerating” in June thanks to strong results in the Midwest and Northeast that offset softness in the South and West, Cotality said in its monthly Home Price Insights report.
“The U.S. housing market is no longer moving in one direction,” Cotality said. “Cotality’s June HPI shows a clear geographic rebalancing: Inventory-constrained Midwest and Northeast markets are still seeing firm price growth, while many former boom markets in the South and West are adjusting to more supply, weaker affordability and greater buyer leverage.”
The national median home price of $427,400 represented an acceleration from 0.8% year-over-year growth in May to 1.2% growth in June. A buyer would need $95,000 annually to afford a home at that price. Looking ahead, Cotality expects home prices to rise another 1.5% between June 2026 and June 2027.
“June data shows a market that is rebalancing, but not uniformly,” Cotality Chief Economist Selma Hepp said. “While the Midwest and Northeast continue to lead price growth, rising for-sale inventory is finally helping to release some of the pressure on those markets. In contrast, the rapid inventory buildup in parts of the South and West has slowed price growth and helped stabilize the price declines seen over the last year.
“After solid spring and early-summer price momentum despite higher mortgage rates, that strength is likely to fade as inflation pressures, labor market weakness and elevated borrowing costs weigh on prospective homebuyers.”
Home Sales Report
The pace of home-price growth accelerated in May after slowing for the previous two years as buyer demand is “aggressively testing the constraints of elevated mortgage rates,” Cotality said in its monthly Home Price Insights report.
The median home price of $424,950 represented an acceleration from 0.6% year-over-year growth in April to 0.8% growth in May. Looking ahead, Cotality expects home prices to rise another 4.8% between May 2026 and May 2027.
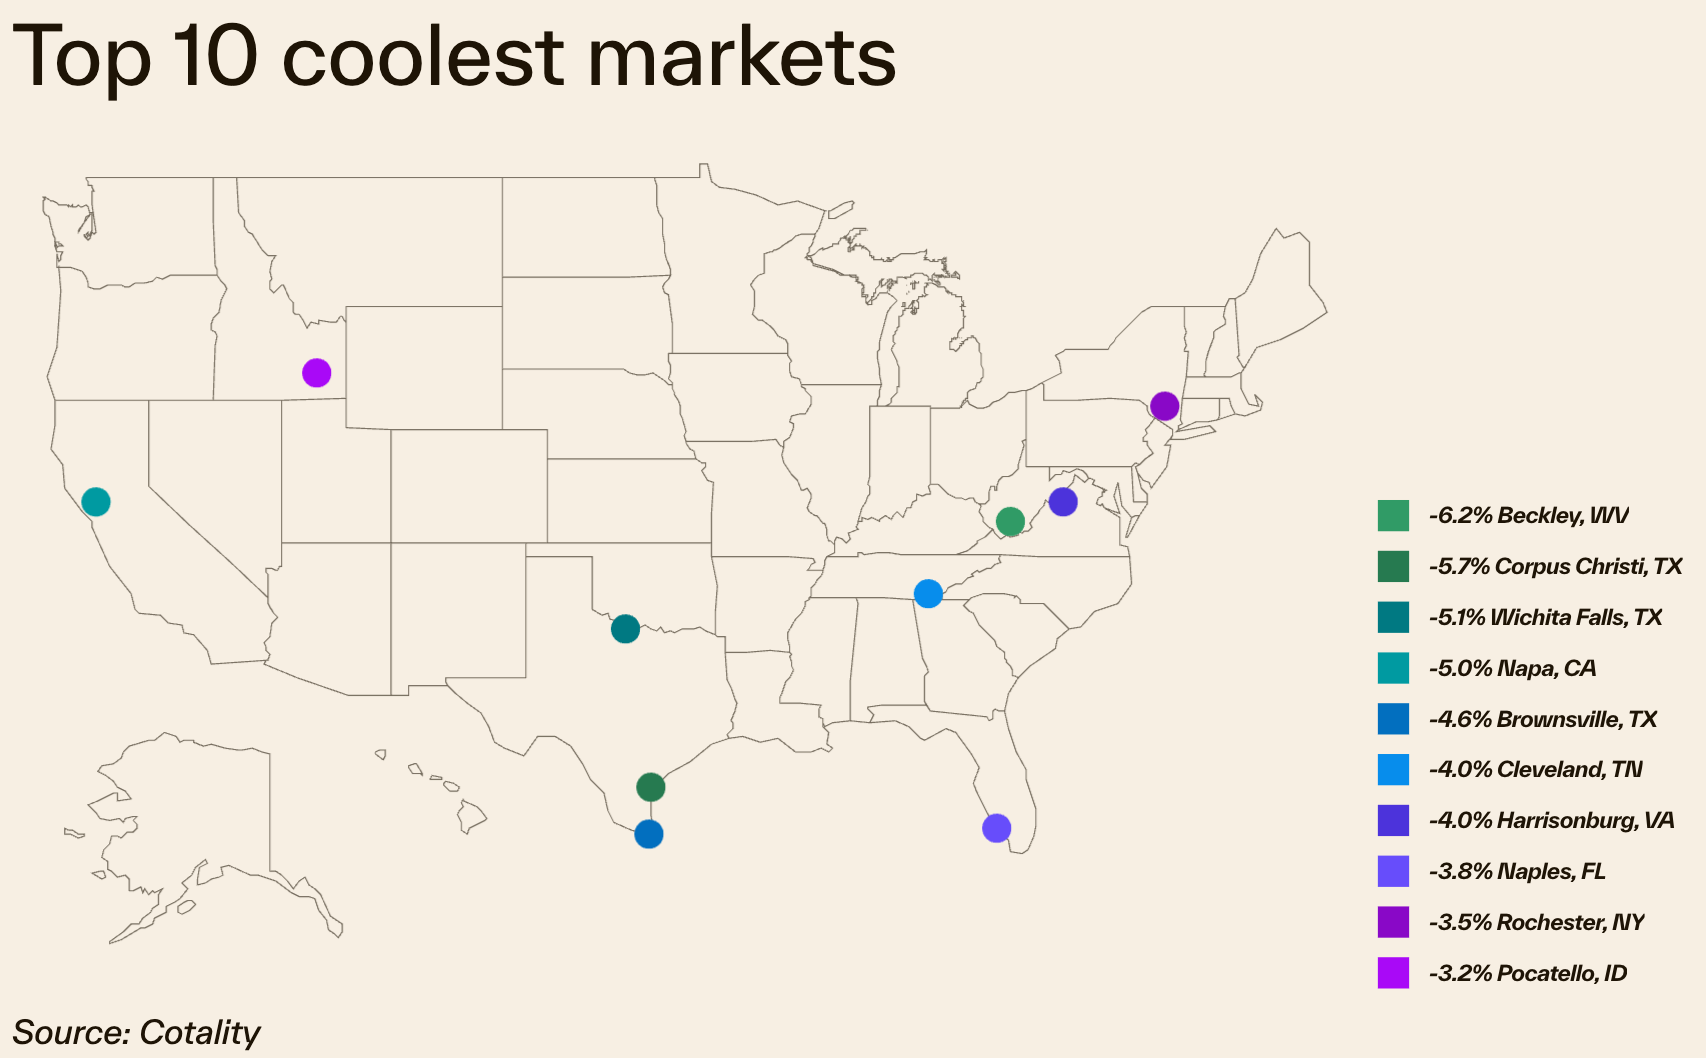
“The U.S. housing market in mid-2026 remains firmly entrenched in a geographic split, shaped fundamentally by an affordability gap and a wealth gap that continues to divide buyers across the nation,” said Cotality Chief Economist Selma Hepp.
The topline national number belies the regional variation in markets. In the relatively affordable Midwest, budget friendly pricing is fueling price increases, as buyers leave expensive coastal markets for the interior of the country and its lower barriers to entry. Meanwhile, markets that experienced the sharpest growth in recent years are entering a cooling phase, and the boomtowns in the South have largely discovered their price floors by now.
“What we are witnessing is a profound segmentation of opportunity,” Hepp explains. “Buyers who are well-insulated from mortgage rate volatility — bolstered by substantial accumulated home equity and robust wealth gains — are continuing to look at high-value regions like San Francisco, driving a strong near-9% annual rebound in a market that remains fundamentally healthy and structurally undervalued relative to long-term income baselines.”
Home-price growth slows amid buyer/seller ‘standoff’
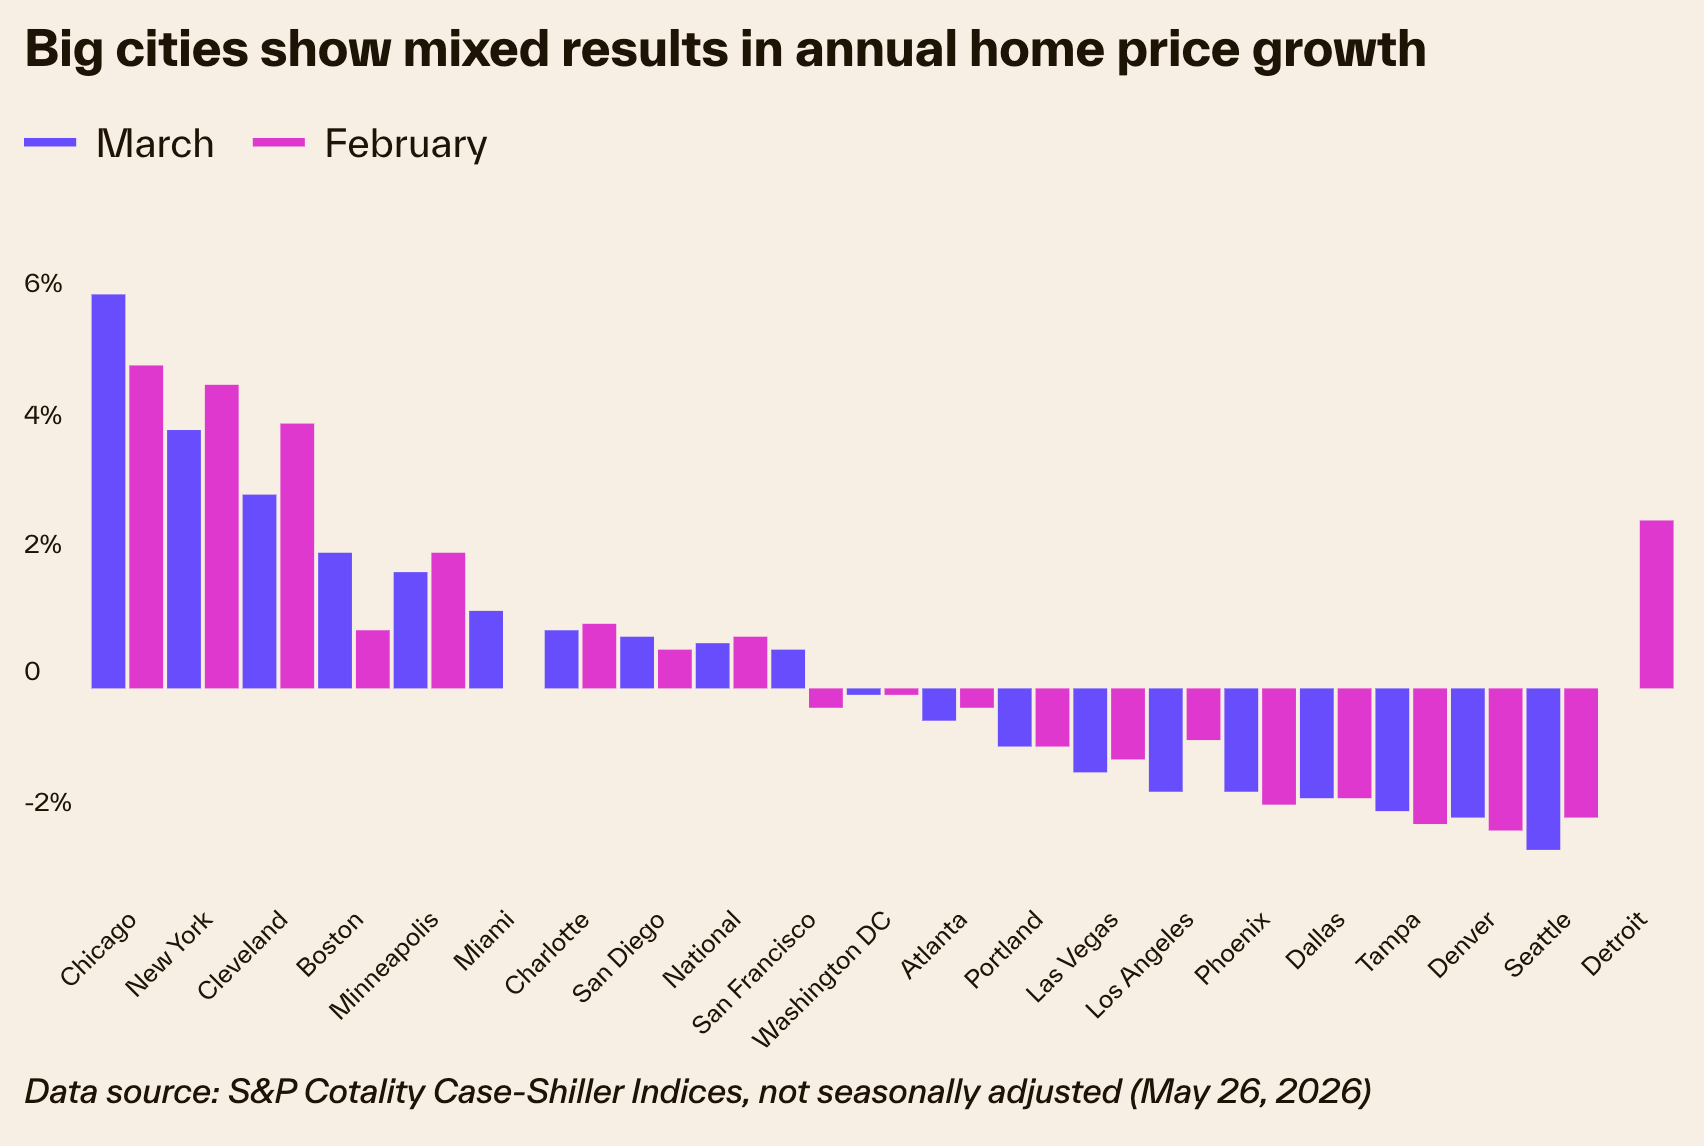
The pace of annualized home-price growth slowed again in March, slipping to 0.66% from 0.75% as buyers and sellers remained in a “standoff,” Cotality said, citing the S&P Cotality Case-Shiller Home Price Index.
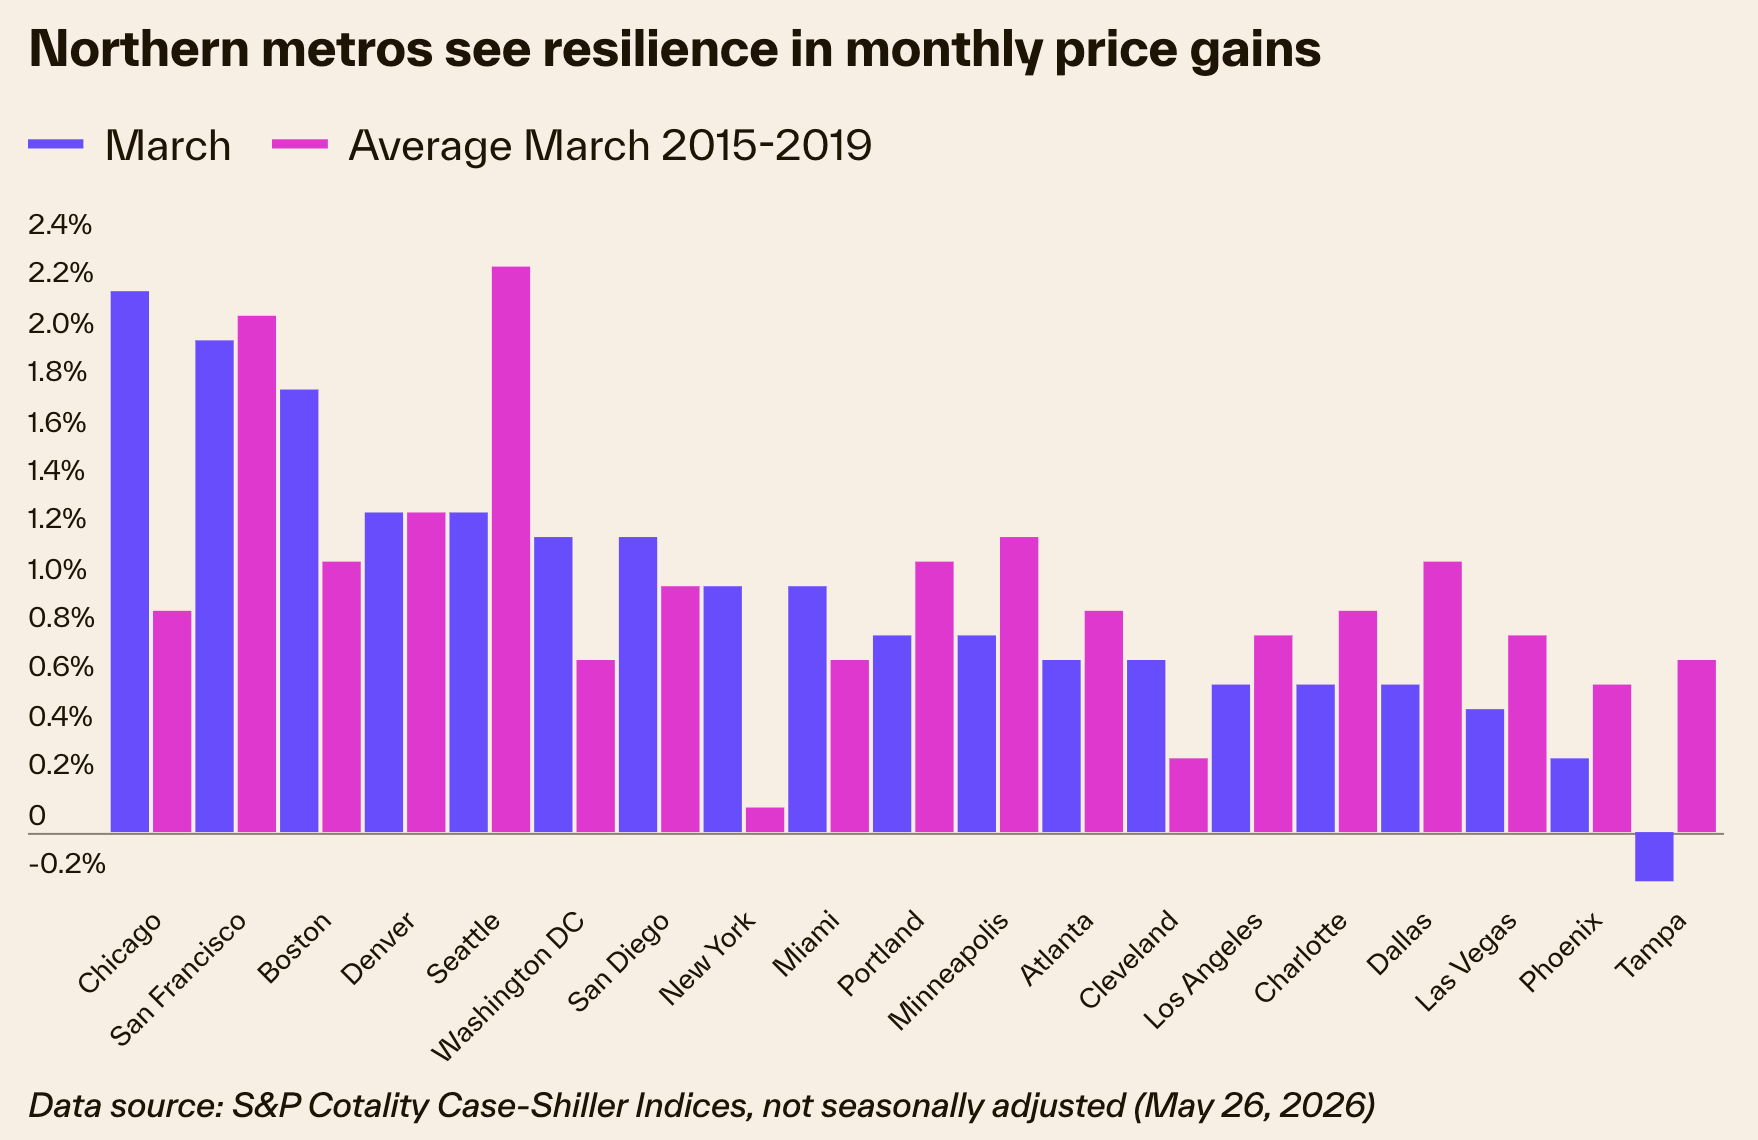
Month over month, March’s price increase dipped to 0.7% from an average 0.8% gain from 2015 to 2019.
“Buyers are rejecting current price tags, but sellers refuse to offer steep discounts. The result is in a standoff,” Cotality Principal Economist Thom Malone said. “Monthly price growth in March was the slowest since 2019. Sales were also low, indicating that sellers are still waiting for the rest of the economy to catch up with the housing market. Still, the modest appreciation points away from any immediate price drops and signals that buyers might be the ones who end up giving the most ground.”
By metro, “older, colder” markets saw the sharpest increases in price growth, led by Chicago, where prices jumped 6.1%, followed by New York (4%), Cleveland (3%) and Boston (2.1%) Chicago also led the pack in terms of month-over-month price growth with a 2.2% gain, followed by San Francisco (2%), Boston (1.8%) and Denver (1.3%).
Ultimately, the United States market remains in a “holding pattern.”
“Prices reflect homeowners who are clinging to the equity,” Cotality said. “But house hunters cannot stretch their budgets any further. This gridlock means homes are spending longer on the market and overall appreciation is flattening out.”
Looking ahead, any changes will depend on whether sellers decide to start trimming asking prices, with any shift in that direction slow to materialize.
“We can expect a housing market defined by minimal, single-digit price growth for the foreseeable future,” Cotality concluded.
Home Sales Report
- Median Sale Price: $735,000
- Year-over-Year Price Change: +4.3%
- Active Listings: 762 units
- New Listings (October): 389
- Median Days on Market: 27 days
- Sales: The Warren Group reported 1,105 condo sales in Greater Boston for September 2025.
- Median Price: The median price for a condo in Greater Boston was $580,000, which is a 3.3% decrease year-over-year.
- Sales: The GBAR reported 669 condo sales in Boston proper for September 2025.
- Median Price: The GBAR reported a higher median price of $670,000 for condos in Boston proper.
___________________________
May home sales report showed, with single-family home sales climbing 6% compared to the same month last year. For Boston condos, the increase was more modest at 0.9%.
The median existing-home sales price topped $400,000 for the first time in May as existing-home sales fell for the fourth month in a row, the National Association of REALTORS® said.
At the same time, total housing inventory rose 12.6% on a month-over-month basis to 1,160,000 units.
Total existing-home sales, which are completed transactions, including single-family homes, townhomes, condominiums and co-ops, slid 3.4% from April to a seasonally adjusted annual rate of 5.41 million in May. Year over year, sales volume was down 8.6% from 5.92 million transactions in May 2021.
The median existing-home price for all housing types in May was $407.600, up 14.8% from a year before, as median prices rose in each region.
“Home sales have essentially returned to the levels seen in 2019 — prior to the pandemic — after two years of gangbuster performance,” NAR chief economist Lawrence Yun said in a press release. “Also, the market movements of single-family and condominium sales are nearly equal, possibly implying that the preference towards suburban living over city life that had been present over the past two years is fading with a return to pre-pandemic conditions.”
A 30-year, conventional, fixed-rate mortgage was 5.23% in May, up from 4.98% in April, according to Freddie Mac. The average commitment rate across all of 2021 was 2.96%.
pril’s unsold inventory represented a 2.6-month supply at the current sales pace, up from 2.2 months in the prior month and down from 2.5 months last year.
rties typically remained on the market for 16 days in May, down from 17 days in both April and May 2021. Eighty-eight percent of homes sold in May were on the market for less than a month.
“Further sales declines should be expected in the upcoming months given housing affordability challenges from the sharp rise in mortgage rates this year,” Yun added. “Nonetheless, homes priced appropriately are selling quickly, and inventory levels still need to rise substantially — almost doubling — to cool home-price appreciation and provide more options for homebuyers.”
By property type, single-family home sales in May slid to a seasonally adjusted annual rate of 4.8 million, down 3.6% from 4.98 million in the previous month and down 7.7% from a year earlier. The median existing single-family home price was $414,200, up 14.6% on a year-over-year basis.
Existing condominium and co-op sales came in at a seasonally adjusted annual rate of 610,000 units in May, down 1.6% from April and 15.3% compared to May 2021. The median existing condo price rose 14.8% year over year to $355,700.
In May, first-time buyers were responsible for 27% of sales, down from 28% in April and down from 31% in May 2021, while individual investors or second-home buyers, who make up many cash sales, purchased 16% of homes, down from 17% in April and 17% in May 2021.
Existing-home sales slide in December while prices continue to climb
Existing-home sales declined in December after three months of increases, while the median sales price rose, marking 118 consecutive months of gains, the longest streak on record, the National Association of Realtors said.
Total existing-home sales, which are completed transactions, including single-family homes, townhomes, condominiums and co-ops, fell 4.6% from November to a seasonally adjusted annual rate of 6.18 million in December. Year over year, sales were down 7.1% from 6.65 million transactions in December 2020.
The median existing-home price for all housing types in December was $358,000, up 15.8% from December 2020, as prices rose in each region, the NAR said in a press release.
Total housing inventory at the end of last month stood at 910,000 units, down 18% from November and down 14.2% from a year earlier. December’s unsold inventory represented a 1.8-month supply at the current sales pace, down from 2.1 months in November and 1.9 months a year ago.
“December saw sales retreat, but the pull back was more a sign of supply constraints than an indication of a weakened demand for housing,” NAR chief economist Lawrence Yun said in the release. “Sales for the entire year finished strong, reaching the highest annual level since 2006.”
Yun expects existing-home sales to slow slightly in coming months as mortgage rates continue to rise. He added that recent employment gains and stricter underwriting standards mean home sales are in no danger of crashing.
Properties typically remained on the market for 19 days in December, up one day from November and down from 21 days in December 2020. Seventy-nine percent of homes sold in December were on the market for less than a month.
By property type, single-family home sales slid to a seasonally adjusted annual rate of 5.52 million, down 4.3% from 5.77 million in November and down 6.8% from a year earlier. The median existing single-family home price was $364,300, up 16.1% on a year-over-year basis.
Existing condominium and co-op sales came in at a seasonally adjusted annual rate of 660,000 units, down 7% from 710,000 in the previous month and down 9.6% compared to November 2020. The median existing condo price rose 11.9% year over year to $305,100.
“We wrapped up the year witnessing home sales exceed the previous year’s total and saw millions of families secure housing,” NAR President Leslie Rouda Smith said. “I think the positive momentum will continue as the market prepares to finally see more supply in the coming months, meaning more buyers will be able to land their dream home.”
In December, first-time buyers were responsible for 30% of sales, up from 26% in November and down from 31% in December 2020, while individual investors or second-home buyers, who make up many cash sales, purchased 17% of homes, up from 15% in November and 14% in November 2020.

Click to View Google Reviews
Updated: Boston Real Estate Blog 2026
________________________________________________________________________________________________________________________
By major U.S. region, sales of existing homes dropped 6.8% in the West, 6.3% in the South and 1.3% in both the Midwest and Northeast.
November home sales report from the National Association of Realtors, updated on December 2, 1014.
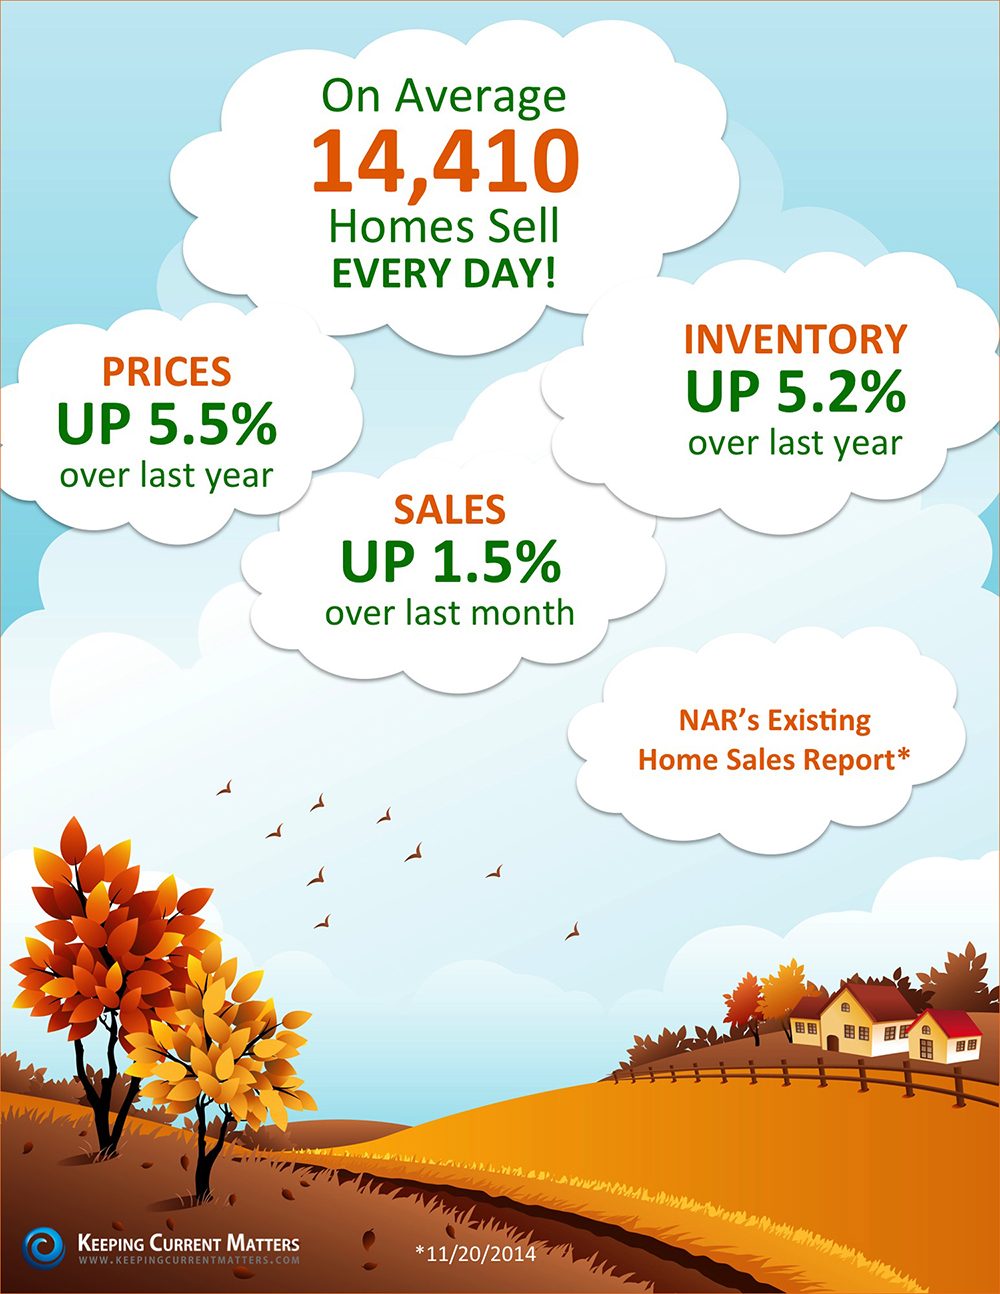
November Home Sales Report
November Home Sales Report.
Click on the November Home Sales Report to enlarge.
The following are some highlights of the National Association of Realtors of existing home sales for the month of November 2014.
1. In the month of November 14,410 existing homes sold every day.
2. The average home sales price in November increased 5.5% over the same time last year.
3. Sales of homes increased by 1.5% in November compared to October 2014.
4. Inventory of exiting homes for sale increased by 5.2% over last year.

November home sales report
Boston Condo sales report of November 2014.
1. Number of Boston condos that sold in November 2014 was 242. Over 8 Boston condominiums sold in Boston per day.
2. Average amount of time for a Boston condo to sell 53 days.
3. The lowest Boston condo sales price was $133,500.
4. The highest Bostonian condominium sales price was $5,850,000.
5. The median sales price in Boston was $480,000.
6. The average property sales price was $6823.500.
7. Total market value of Boston condo that sold last month was $165,172,788.
Boston Single-family home sales.
Sixty-four Boston Single-family homes sold in the month of November 2014, with an average sales price of $682,000. The highest recorded sales price was $9.250,000 and the least expensive was $195,000.
If you’d like more information on Boston condominium sale data or on single-family homes, please feel free to call me at 617-720-5454. Please visit our website (Boston Real Estate Blog) everyday for the most updated news on the Boston real estate market. Feel free to email me at realtyford@yahoo,.com if you have any questions on the condo market.
Source: National Association of Realtors
Three bedroom Charlestown condo for sale.
Boston condo for sale in Charlestown.
One bedroom Boston condo for sale in Charlestown Massachusetts.
Boston condominiums for sale in the Back Bay area.
New Boston condos for sale in Back Bay.
Luxury Boston condos for sale in Back Bay.
The best Back Bay condos for sale.
View luxury Back Bay condominiums and homes for sale.
View new Beacon Hill condos and townhouses for sale in all price ranges.
Today’s newest Boston condos for sale in one of the finest areas of Boston.
Boston South End condos and homes for sale, new to the market.
Source: MLS
View Back Bay condos for sale:
Newest Back Bay real estate listing for sale.
Back Bay luxury condominium for sale.
Use the quick search box to view new Back Bay condos for sale.
For more information on how to be a Boston condo owner please contact John Ford at 617-720-5454. You can also email at realtyford@yahoo.com
Back to Boston condos for sale homepage
Contact me to find to set up an appointment to start your Boston condo buying process.
SEARCH FOR CONDOS FOR SALE AND RENTALS
For more information please contact one of our on-call agents at 617-595-3712.
Updated: January 2018

