
Housing affordability plunges
Boston Condos for Sale and Apartments for Rent
Housing affordability plunges
Housing affordability plunges
Housing affordability plunges
The aughts are back in style, with early-2000s inspiration trending in fashion, music and mortgage costs.
Housing affordability last month reached its lowest point since at least 2007, according to a recent report from Zillow. That’s as far back as the company’s affordability metric goes.
Boston condo for sale prices continued their rise, though the growth acceleration finally showed signs of slowing last month. Meanwhile, mortgage rates and payments continue to balloon, while inventory is not recovering quickly enough to ease the supply-demand disparity.
Mortgage rates were flirting with the 6 percent mark last week, mere months after exceeding the 5 percent threshold. The rates are still historically low, but significantly higher than they were in the first couple of years of the pandemic.
As a result, mortgage payments are rocketing. At Thursday’s average rate of 5.78 percent, the mean monthly mortgage payment in the country would be $2,127, according to Zillow. That’s a 51 percent surge year-over-year and a 36 percent increase from the beginning of the year.
In April, monthly mortgage payments took 28 percent of homeowners’ income.
There are small glimmers of hope for Boston condo buyers. According to Zillow’s index, price growth in April was 20.9 percent versus 20.7 percent in May. Last month was the first in more than a year to feature a deceleration in price growth, according to Zillow; the S&P CoreLogic Case-Shiller Index for May won’t be out until late next month.
Inventory is also showing signs of recovery. Listings increased 10.5 percent from the previous month in April. Listings are still 14.2 percent below levels from the previous year, though, and 50 percent below the mark of May 2019.
Weary Boston condo buyers can’t exactly kick back and turn to the Boston apartment rental market. The Boston apartment rental market is also shooting up similarly to mortgage payments — May’s annual rent appreciation was 15.9 percent and the typical rent in the country was only a few cups of coffee shy of $2,000; Redfin reported that the benchmark was exceeded last month.
Click Here to view: Google Ford Realty Inc Reviews

At the national level, housing affordability declined in May compared to a year ago according to NAR’s Housing Affordability Index, as the median family incomes rose modestly by 1.2% while the monthly mortgage payment increased 20%. The effective 30-year fixed mortgage rate1 was 3.01% this May compared to 3.29% one year ago, but the median existing home sales price rose 24.4% from one year ago.
Compared to the prior month, affordability also worsened as the monthly mortgage payment rose by 1.7% while the median family income declined by 1.0%.


As of May 2021, the national and regional indices were all above 100, meaning that a family with the median income had more than the income required to afford a median-priced home. The income required to afford a mortgage, or the qualifying income, is the income needed so that mortgage payments account for 25% of family income.2 The most affordable region was the Midwest, with an index value of 196.4 (median family income of $86,440 with a qualifying income of $44,016). The least affordable region remained the West, where the index was 113.1 (median family income of $94,183 and a qualifying income of $83,280). The South was the second most affordable region with an index of 159.7 (median family income of $80,019 and a qualifying income of $50,112) The Northeast was the second most unaffordable region with an index of 157.2 (median family income of $99,087 and a qualifying income of $63,024).


Housing affordability3 declined from a year ago in of the four regions. The South had the biggest decline of 15.5%. The Midwest region experienced a weakening in price growth compared to a year ago of 11.5%, followed by the West with a dip of 10.7%. The Northeast had the smallest decrease of 10.5%.
Affordability is down in all four regions from last month. The South had the biggest decline of 3.9% followed by the Midwest which fell 3.1%. The West region fell modestly 0.5% followed the Northeast region with the smallest decrease of 0.4%.
Nationally, mortgage rates were down 28 basis points from one year ago (one percentage point equals 100 basis points).
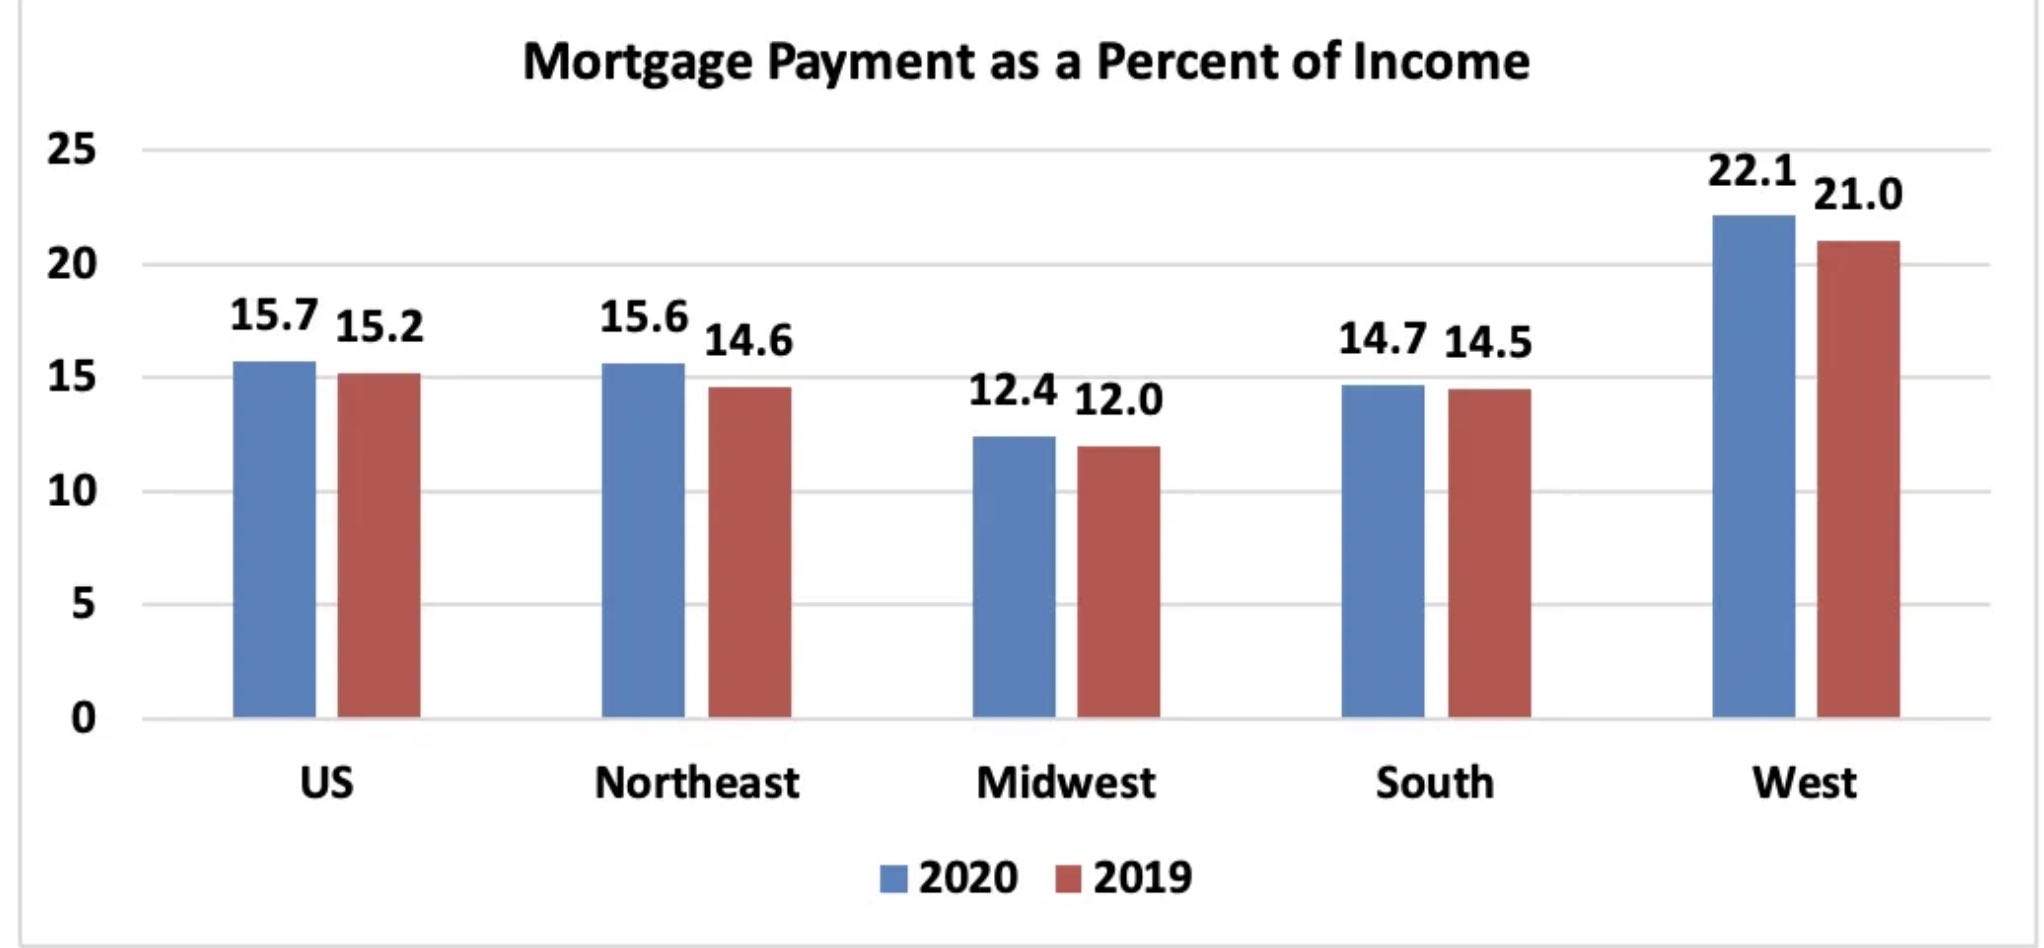
Compared to one year ago, the monthly mortgage payment rose to $1,204 from $1,003, an increase of 20.0%, The annual mortgage payment as a percentage of income inclined to 16.5% this May from 13.9% from a year ago due to higher home prices and a decline in median family incomes. Regionally, the West has the highest mortgage payment to income share at 22.1 % of income. Home prices in the West have reached an all-time high of $513,700. The Northeast had the second highest share at 15.9% followed by the South with their share at 15.7%. The Midwest had the lowest mortgage payment as a percentage of income at 12.7%. Mortgage payments are not burdensome if they are no more than 25% of income.4
With an abundance of buyers looking at slowly increasing inventory, demand is forcing home prices to continue to rise. Mortgage rates have been declining for the last three months and are still historically low.
This week, The Mortgage Bankers Association reported a decline in mortgage applications from a week ago.5 Mortgage credit availability was up 1.4 in May which means credit was loosening.
What does housing affordability look like in your market? View the full data release.
The Housing Affordability Index calculation assumes a 20% down payment and a 25% qualifying ratio (principal and interest payment to income). See further details on the methodology and assumptions behind the calculation.
‘Housing affordability plunges’
Higher income, backed up by lower mortgage rates, has expanded the financial reach of the average homebuyer. However, an increased demand for homes has concurrently driven up prices, negating two of the three main factors in the index, First American said in a press release.
Boston real estate and lower mortgage rates
“Lower mortgage rates and higher household income compared with one year ago propelled an 11% increase in house-buying power. However, surging house-buying power drives demand, and rising demand in a supply constrained market accelerates nominal house price appreciation,” chief economist Mark Fleming said. “In March, the final component of the RHPI, nominal house prices, appreciated at its fastest annual pace since 2005, 14.8%, wiping out any affordability boost from rising house-buying power.
First American’s index measures the price changes of single-family properties adjusted for the impact of income and interest rates on consumer homebuying power at national, state and metropolitan levels.
Geographically, the drop in affordability was widespread, according to First American.
The five markets with the greatest year-over-year declines in affordability were Kansas City, Mo.; Phoenix; Tampa, Fla.; Seattle; and Austin, Texas.
“In March, Kansas City had the greatest year-over-year decrease in affordability, mostly due to the 4.3% annual decline in household income and a 16.5% increase in nominal house prices compared with a year ago,” Fleming said. “Phoenix and Tampa both had even faster nominal house price appreciation than Kansas City, but household incomes held steady in both markets, so the relative affordability loss was less than in Kansas City. Seattle and Austin faced both faster nominal house price growth and lower household income, fueling declines in affordability in both cities.”
Downtown Boston real estate for sale
________________________________________________________________________________________________________________________
It feels strange to write about Boston condos for sale affordability during a pandemic with high unemployment. Even though mortgage rates are down the cost of housing is outpacing wage growth.
According to the National Association of Realtors affordability has declines which is a kind of backward way of saying the housing is less affordable:
“Affordability is down in two of the four regions from last month. The South had a gain of 1.8% followed by the Midwest with an incline of 2.3%. The Northeast had a decline of 1.1% followed by the West with a dip of 2.3%.”
Housing. Regionally, the West has the highest mortgage payment to income share at 20.9% of income. The Northeast had the second highest share at 15.0% followed by the South with their share at 14.7%.
Boston real estate
*The chart is a screen print from the National Association of Realtors website.
Filed under: Making do
Back to Boston condos for sale homepage
Contact me to find out more about this property or to set up an appointment to see it.
SEARCH FOR CONDOS FOR SALE AND RENTALS
For more information please contact one of our on-call agents at 617-595-3712.
Downtown Boston real estate for sale

Ford Realty Inc., Charles Street, Beacon Hill
Click Here to view: Google Ford Realty Inc Reviews

