
The S&P/Case-Shiller Index is as good a gauge as any of what’s going on in the national real estate scene.
It does have its weaknesses, though.
Mainly, it doesn’t include condominiums in its data, only single-family homes.
So, the strengths (or weaknesses) of markets such as Manhattan and Boston are not reflected, accurately.
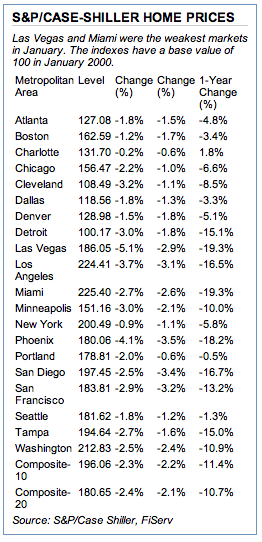
For comparison sake, though, here is a chart which compares January sales with a year ago.
The important number, to me at least, is the one year change, but even that is limited in usefulness, since prices had already begun going down, in 2007. Somewhere, no doubt, there is a break-down, year by year, going back to 2000.
The other number of some importance is the change in prices since 2000. This chart shows a “base value” in 2000 of 100 for all markets.
Boston metropolitan area prices in 2008 (through January 2008) at 162.8.
Holy cow, you say.
Exactly.
Source: S&P / Case-Shiller Index, by way of Matrix
Boston Real Estate for Sale
Click here back to Boston Real Estate Home Search
Ford Realty – Boston Real Estate Google Reviews 2019 & 2020
Click Here: Seaport Luxury high rise condos
Click here: Beacon Hill Apartment rentals

