
S&P CoreLogic Case-Shiller U.S. National Home Price Index.
Boston Condos for Sale
Loading...
The pace of U.S. home-price growth lagged the rate of inflation for the third month in a row in July, reflecting a reversal of fortune from the pandemic years, when homes appreciated much faster than consumer prices increased, S&P Dow Jones Indices said.
“July’s results reinforce that the housing market has downshifted to a much slower gear,” said Nicholas Godec, head of fixed income tradables and commodities at S&P Dow Jones. “U.S. home values have essentially stagnated after inflation, marking the third straight month of real housing wealth decline for homeowners. This reversal is striking: During the pandemic boom, home prices were climbing far faster than inflation, rapidly boosting homeowners’ real equity. Now, the situation has flipped — over the last year, owning a home yielded a modest nominal gain, but an inflation-adjusted loss.”
The S&P Cotality Case-Shiller U.S. National Home Price Index rose just 1.7% year over year in July, down from the 1.9% annual gain measured in June and below the 2.7% rise in consumer prices. In fact, S&P Dow Jones noted, the 1.7% gain is one of the weakest annual increases in the last 10 years. Month over month, the index slid 0.2%.
The S&P Cotality Case-Shiller 10-city composite index rose 2.34% year over year, while the 20-city composite rose 1.84%. Month over month, the 10-city was down 0.31%, while the 20-city was down 0.29%.
“Looking ahead, the housing market appears to be settling into a new, more measured equilibrium,” Godec said. “The era of 15-20% annual home-price jumps is behind us, and in its place, we’re seeing growth rates closer to overall inflation — or even a bit below it. While that means homeowners aren’t gaining wealth at the breakneck pace of the recent past, it also signals a potentially healthier trajectory for housing in the long run.”
In Boston
In Boston, home prices jumped 4.06% year over year in July and slid 0.16% month over month.
“Looking ahead, the housing market appears to be settling into a new, more measured equilibrium,” Godec said. “The era of 15-20% annual home-price jumps is behind us, and in its place, we’re seeing growth rates closer to overall inflation — or even a bit below it. While that means homeowners aren’t gaining wealth at the breakneck pace of the recent past, it also signals a potentially healthier trajectory for housing in the long run.”
S&P CoreLogic Case-Shiller U.S. National Home Price Index.
Case-Shiller: Boston home-price growth rises in May, as national market undergoes ‘slow unwind’
The pace of U.S. home-price growth fell for the fourth month in a row in May, dipping to its slowest rate since July 2023 as markets continued “the slow unwind” of pandemic-era appreciation, S&P Dow Jones Indices said.
Specifically, the S&P CoreLogic Case-Shiller U.S. National Home Price Index rose 2.3% year over year, down from the 2.7% annual gain measured in April. Month over month, the index rose 0.4%.
The 10-city composite index rose 3.4% year over year, down from a 4.1% increase in April, while the 20-city composite rose 2.8%, down from 3.4% in April.
“Seasonal momentum is proving weaker than usual, and the slowdown is now more than just a story of higher mortgage rates,” said Nicholas Godec, head of fixed income tradables and commodities at S&P Dow Jones Indices. “It reflects a market recalibrating around tighter financial conditions, subdued transaction volumes and increasingly local dynamics. With affordability still stretched and inventory constrained, national home prices are holding steady, but barely.”
In Boston, home prices rose 4.6% year over year in May, up from a 3.9% gain in April.
“Persistently high mortgage rates and economic uncertainty led to a 2025 homebuying season defined by low activity,” Cotality Chief Economist Selma Hepp said. “Potential buyers seem weighted down by concerns around financial stability, policy uncertainty and job security.
“Despite inventory increases that tilted many markets in favor of buyers, dampened homebuying demand resulted in overall weak sales activity. Similarly, there are muted sales expectations for the rest of the year.”
South Boston condo buyer
Ford Realty Beacon Hill – Condo for Sale Office

Boston condos for sale – Ford Realty Inc
Updated: Boston Condos for Sale Blog 2025
Byline – John Ford Boston Beacon Hill Condo Broker 137 Charles St. Boston, MA 02114
Are Home Prices Going To Come Down?

Today’s headlines and news stories about home prices are confusing and make it tough to know what’s really happening. Some say home prices are heading for a correction, but what do the facts say? Well, it helps to start by looking at what a correction means.
Here’s what Danielle Hale, Chief Economist at Realtor.com, says:
“In stock market terms, a correction is generally referred to as a 10 to 20% drop in prices . . . We don’t have the same established definitions in the housing market.”
In the context of today’s housing market, it doesn’t mean home prices are going to fall dramatically. It only means prices, which have been increasing rapidly over the last couple years, are normalizing a bit. In other words, they’re now growing at a slower pace. Prices vary a lot by local market, but rest assured, a big drop off isn’t what’s happening at a national level.
The Real Estate Market Is Normalizing
From 2020 to 2022, home prices skyrocketed. That rapid increase was due to high demand, low interest rates, and a shortage of homes for sale. But, that kind of aggressive growth couldn’t continue forever.
Today, price growth has started to slow down, which is a sign the market is beginning to normalize. The most recent data from Case-Shiller shows that after being basically flat for a couple of months last year, prices are going up at a national level – just not as quickly as before (see graph below):
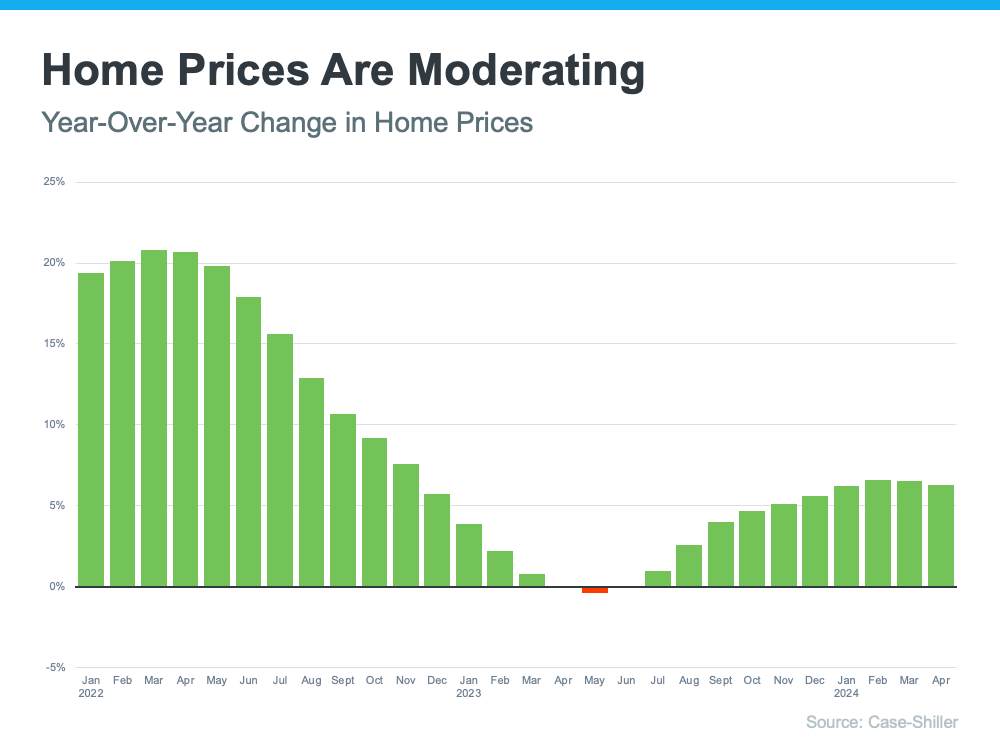 The big takeaway? So far this year, there’s been a much healthier pace of price growth compared to the pandemic.
Of course, that’s what’s happening now, but you may be wondering what’s next for prices. Marco Santarelli, the Founder of Norada Real Estate Investments, says:
“Expert forecasts lean towards a moderation in home price growth over the next five years. This translates to a slower and more sustainable pace of appreciation compared to the breakneck speed witnessed in recent years, rather than a freefall in prices.”
It’s all about supply and demand. Increasing inventory plus limited buyer demand, due to relatively high mortgage rates, will continue to ease some of the upward pressure on prices.
What This Means for Boston Condo Buyers?
If you’re thinking about buying a home, slowing price growth is welcome news. Skyrocketing home prices during the pandemic left many would-be homebuyers feeling priced-out.
While it’s still a good thing to know the value of the home you buy will likely continue to go up once you own it, slowing price gains are making things feel more manageable. Odeta Kushi, Deputy Chief Economist at First American, says:
“While housing affordability is low for potential first-time home buyers, slowing price appreciation and lower mortgage rates could help — so the dream of homeownership isn’t boarded up just yet.”
Boston Condos for Sale and the Bottom Line
At the national level, home prices are not going down. And most experts forecast they’ll continue growing moderately moving forward. But prices vary a lot by local market. That’s where a trusted real estate agent comes into play. If you have questions about what’s happening with prices in your area, reach out to an agent.
Peace be with you
Visit our office at 137 Charles Street Rear, Beacon Hill MA 02114
This content is currently unavailable. Please check back later or contact the site's support team for more information.
Beacon Hill Condos for Sale
Updated: Boston Real Estate Blog 2025
Condo Broker 137 Charles St. Boston, MA 02114

Updated: Boston Real Estate Blog 2025
View Ford Realty Inc Google Reviews
Where is Ford Realty Located?
Ford Realty is located in 137 Charles Street in Beacon Hill
S&P CoreLogic Case-Shiller U.S. National Home Price Index.
Boston Condos for Sale
Loading...
S&P CoreLogic Case-Shiller U.S. National Home Price Index.
Nationwide, the seasonally adjusted housing index rose 2% month over month in February and 13.2% year over year, up from a monthly increase of 1.2% in February.
The national year-over-year gain is the highest recorded since December 2005, Craig Lazzara, managing director and global head of index investment strategy at S&P Dow Jones Indexes, said in a press release.
The 10-city composite index rose 2.0% on a monthly basis and 12.8% on a yearly basis, while the 20-city composite rose 2.2% monthly and 13.3% annually.
All 20 cities in the composite index posted gains, and the increases in every city are above that city’s median level, Lazzara said.
“These data are consistent with the hypothesis that COVID has encouraged potential buyers to move from urban apartments to suburban homes,” Lazzara said. “This demand may represent buyers who accelerated purchases that would have happened anyway over the next several years. Alternatively, there may have been a secular change in preferences, leading to a permanent shift in the demand curve for housing. More time and data will be required to analyze this question.”
Boston Condos for Sale
Loading...
____________________________________________________________________________________________________________________________________________________________________________
From CNBC:
Nationally, prices rose 4.5% annually in May, according to the S&P CoreLogic Case-Shiller U.S. National Home Price Index. That is down from the 4.6% gain in April.
Home prices in the 10-city composite increased 3.1% annually, down from 3.3% in the previous month. The 20-city composite rose 3.7% year over year, down from 3.9% in April (Detroit was excluded from the composite due to data collection issues).
Home values increased in all 19 of the cities for which data was available, but the gains accelerated in just three. Prices were accelerating in 12 cities in April and 18 cities in March.
Regionally, price gains in Phoenix, Seattle and Tampa continued to be the strongest in the nation. Phoenix posted a 9% year-over-year price increase, followed by Seattle with a 6.8% increase and Tampa with a 6% increase. Price gains were smallest in Chicago, New York and San Francisco.
May 2020 | May/April | April/March | 1-Year | |||||
Metropolitan Area | Level | Change (%) | Change (%) | Change (%) | ||||
Atlanta | 158.94 | 0.5% | 0.8% | 4.2% | ||||
Boston | 231.35 | 0.4% | 1.4% | 4.3% | ||||
Charlotte | 172.57 | 0.8% | 1.1% | 5.4% | ||||
Chicago | 146.96 | 0.7% | 1.0% | 1.3% | ||||
Cleveland | 132.00 | 1.2% | 1.6% | 5.7% | ||||
Dallas | 196.71 | 0.5% | 0.7% | 2.8% | ||||
Denver | 231.39 | 0.5% | 1.0% | 3.9% | ||||
Detroit | – | – | – | – | ||||
Las Vegas | 200.78 | 0.3% | 0.8% | 4.2% | ||||
Los Angeles | 297.00 | 0.4% | 0.7% | 3.7% | ||||
Miami | 252.70 | 0.3% | 0.6% | 4.0% | ||||
Minneapolis | 186.76 | 0.8% | 1.9% | 5.5% | ||||
New York | 204.88 | 0.0% | 0.4% | 2.1% | ||||
Phoenix | 208.25 | 0.9% | 1.4% | 9.0% | ||||
Portland | 248.14 | 0.9% | 0.6% | 4.2% | ||||
San Diego | 273.51 | 0.4% | 1.2% | 5.2% | ||||
San Francisco | 275.59 | -0.2% | 0.5% | 2.2% | ||||
Seattle | 271.45 | 0.6% | 1.4% | 6.8% | ||||
Tampa | 231.53 | 0.3% | 0.9% | 6.0% | ||||
Washington | 241.94 | 0.6% | 0.7% | 3.5% | ||||
Composite-10 | 236.98 | 0.3% | 0.7% | 3.1% | ||||
Composite-20 | 224.76 | 0.4% | 0.8% | 3.7% | ||||
U.S. National | 218.87 | 0.7% | 1.0% | 4.5% | ||||
Sources: S&P Dow Jones Indices and CoreLogic | ||||||||
Data through May 2020 | ||||||||

