
Boston Condos for Sale and Apartments for Rent
The Boston economic forecast
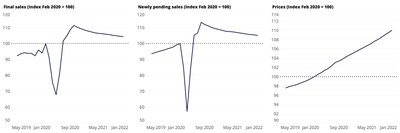
- Buyers are still extremely keen to purchase houses, with newly pending sales up 21.8% compared to last year. However, the frenzied activity of the summer is showing signs of the typical fall slowdown, dropping 2.8% compared to a month ago and down 1% since the week prior.
- Typical time-on-market for listings stayed steady at 13 days, which is 14 days quicker than last year. Among the 50 largest U.S. markets, Cincinnati and Columbus, Ohio, shared the shortest typical time on market at four days to pending. Nashville posted the longest typical time on market at 33 days, while New York and Virginia Beach both marked 32.
- Total inventory dropped even further in a steady decline that began the first week of June. For-sale listings fell an enormous 34.6% below this week last year; the largest year-over-year deficit seen since Zillow’s weekly stats began in 2019.
- There were 13.6% fewer new listings last week than at this point last year.
- The median sale price continued its meteoric rise to $284,000 as of the week ending Aug. 8, 8.7% higher than the previous year and the largest year-over-year increase seen since at least the beginning of 2019. Sale prices were up 2% over the month prior.
- The median list price rose to $345,000, a full 10% over last year but just 0.1% higher than a month prior.
- New home sales have been particularly robust, even within this astounding buying season. The annualized pace of new home sales in August exceeded 1 million homes — a benchmark unseen since 2006.
Metropolitan Area* | Newly Pending Sales – YoY | Newly Pending Sales – WoW | Median Days to Pending | Total For-Sale Listings – YoY | New For-Sale Listings – YoY | New For-Sale Listings – WoW | Median Sale Price** | Median Sale Price – YoY** |
United States | 21.8% | -1.0% | 13 | -34.6% | -13.6% | 4.2% | 284000 | 8.7% |
New York/Newark, NY/NJ | 60.4% | 0.8% | 32 | -20.1% | -11.5% | -0.8% | 445000 | 2.7% |
Los Angeles, CA | 8.1% | 0.7% | 12 | -24.9% | 8.4% | 3.4% | 713375 | 7.7% |
Chicago, IL | 38.2% | -2.2% | 13 | -28.5% | -1.0% | 8.7% | 264500 | 7.3% |
Dallas-Fort Worth, TX | 30.6% | -0.3% | 23 | -31.8% | -24.4% | 1.4% | 303812 | 9.1% |
Philadelphia, PA | 37.1% | 3.3% | 9 | -37.3% | -5.8% | 10.5% | 279000 | 5.3% |
Houston, TX | 25.4% | -0.2% | 17 | -29.1% | -17.3% | 8.2% | 271529 | 9.9% |
Washington, DC | 21.8% | 2.9% | 7 | -34.4% | -1.6% | 3.6% | 459431 | 8.4% |
Miami-Fort Lauderdale, FL | 40.1% | 2.6% | 27 | -13.4% | -12.3% | 4.6% | 329750 | 12.4% |
Atlanta, GA | 15.8% | -3.3% | 14 | -30.6% | -22.0% | 6.3% | 283850 | 10.4% |
Boston, MA | 6.3% | 2.4% | 8 | -30.5% | -18.9% | 1.6% | 522500 | 8.1% |
San Francisco, CA | 34.4% | -1.6% | 12 | -4.3% | 3.1% | 24.0% | 896500 | 12.1% |
Detroit, MI | 41.8% | -3.3% | 8 | -38.1% | -14.9% | 12.1% | 222975 | 11.7% |
Riverside, CA | 12.0% | -1.4% | 9 | -48.1% | 6.6% | 6.0% | 411250 | 10.3% |
Phoenix, AZ | 18.9% | 3.1% | 11 | -21.6% | 0.0% | 11.9% | 322500 | 11.9% |
Seattle, WA | 20.5% | -2.3% | 6 | -32.2% | -6.3% | -2.8% | 535525 | 11.1% |
Minneapolis-St. Paul, MN | 31.2% | 1.1% | 17 | -27.1% | 3.9% | -0.3% | 311625 | 9.3% |
San Diego, CA | 8 | -38.2% | 2.5% | -1.7% | 635188 | 8.9% | ||
St. Louis, MO | 16.8% | -1.6% | 6 | -38.4% | -11.2% | 14.7% | 217912 | 10.7% |
Tampa, FL | 8 | -34.8% | -16.4% | -4.4% | 258409 | 9.5% | ||
Baltimore, MD | 17.2% | 6.6% | 12 | -44.8% | -12.7% | 9.3% | 317500 | 0.8% |
Denver, CO | 25.8% | -1.5% | 6 | -34.2% | 16.2% | 21.8% | 462881 | 6.5% |
Pittsburgh, PA | 52.3% | 1.3% | 9 | -27.2% | -2.3% | 11.8% | 199499 | 7.7% |
Portland, OR | 21.9% | -5.5% | 6 | -37.0% | -28.4% | -1.3% | 440225 | 8.6% |
Charlotte, NC | -1.8% | -1.1% | 6 | -42.9% | -19.2% | 14.2% | 286500 | 8.5% |
Sacramento, CA | 18.3% | -1.5% | 7 | -44.1% | 0.3% | 1.6% | 452875 | 8.1% |
San Antonio, TX | 34.4% | 0.6% | 27 | -25.7% | -23.1% | 11.0% | 252812 | 8.2% |
Orlando, FL | 12 | -17.0% | -3.0% | 11.4% | 282562 | 7.8% | ||
Cincinnati, OH | 12.0% | 0.7% | 4 | -39.1% | -3.7% | 21.9% | 212125 | 11.8% |
Cleveland, OH | 70.9% | 0.3% | 18 | -39.8% | -0.8% | -2.5% | 175350 | 9.6% |
Kansas City, MO | 15.4% | -0.6% | 5 | -43.7% | -4.9% | 22.8% | 259250 | 12.7% |
Las Vegas, NV | 18.5% | -1.4% | 15 | -23.3% | 8.3% | 2.3% | 304750 | -0.1% |
Columbus, OH | 18.6% | 0.6% | 4 | -40.1% | -11.4% | 10.4% | 240500 | 16.1% |
Indianapolis, IN | 14.0% | 2.4% | 5 | -41.0% | 6.7% | 31.9% | 222625 | 8.4% |
San Jose, CA | -9.7% | -3.5% | 15 | -20.2% | 20.3% | 18.1% | 1139375 | 8.6% |
Austin, TX | 29.2% | 2.0% | 8 | -37.0% | -2.9% | 41.5% | 357978 | 12.4% |
Virginia Beach, VA | 32 | -40.7% | -1.3% | 0.7% | 276912 | 8.1% | ||
Nashville, TN | 33 | -24.0% | -36.9% | 17.5% | 317850 | 5.1% | ||
Providence, RI | -2.9% | 3.7% | 13 | -38.3% | -24.4% | 4.2% | 318600 | 5.4% |
Milwaukee, WI | 28 | -6.5% | -6.2% | 31.2% | 207475 | 6.9% | ||
Jacksonville, FL | 43.2% | 1.4% | 14 | -36.7% | -17.0% | 0.2% | 268362 | 1.3% |
Memphis, TN | 33.9% | 1.1% | 7 | -45.4% | -20.2% | 6.1% | 209212 | 7.0% |
Oklahoma City, OK | 20.4% | -4.6% | 10 | -35.5% | -6.2% | 24.8% | 205750 | 12.5% |
Louisville, KY | 3.0% | -0.6% | 5 | -43.9% | -8.3% | 1.3% | 217812 | 9.0% |
Hartford, CT | 49.6% | -1.3% | 10 | -41.5% | 5.7% | 10.9% | 258800 | 7.8% |
Richmond, VA | 6 | -39.9% | -10.0% | 9.3% | 284688 | 7.9% | ||
New Orleans, LA | 4.1% | -1.7% | 17 | -44.0% | -20.8% | -2.0% | 232875 | 6.6% |
Buffalo, NY | 18.7% | -2.5% | 10 | -36.2% | -8.6% | -0.3% | 189850 | 9.7% |
Raleigh, NC | 15.0% | 1.3% | 5 | -41.4% | -25.7% | 13.1% | 312812 | 5.8% |
Birmingham, AL | 43.2% | 0.9% | 8 | -35.4% | 9.3% | 22.3% | 224942 | 4.8% |
Salt Lake City, UT | 6 | -45.5% | -33.7% | 29.8% | 381916 | 11.2% |
*Table ordered by market size |
**Sale price data as of the week ending Aug. 8 |
1 The Zillow Weekly Market Reports are a weekly overview of the national and local real estate markets. The reports are compiled by Zillow Economic Research and data is aggregated from public sources and listing data on Zillow.com. New for-sale listings data reflect daily counts using a smoothed, seven-day trailing average. Total for-sale listings, newly pending sales, days to pending and median list price data reflect weekly counts using a smoothed, four-week trailing average. National newly pending sales trends are based upon aggregation of the 38 largest metro areas where historic pending listing data coverage is most statistically reliable, and excludes som |

