
Realtors express ‘caution but optimism’ about the housing market in 2022
Realtors are saying that the market is slowing, and Marc D. suggested that we define what that means:
A slowing market is when fewer active listings are priced to sell.
It is a result of…..
Fewer buyers – Higher mortgage rates priced out some or most of the buyers hoping to finance their purchase. They are simultaneously hoping for prices to come down to compensate, and/or in the process of making other adjustments like considering smaller homes, widening their target zone, or offsetting higher rates with bigger down payments or an adjustable-rate mortgage. All of which take time, so more buyers than ever are in the wait-and-see mode, which means…..
Fewer sales – as more buyers move to the sidelines, it’s disrupting the incredible sales flow we’ve enjoyed over the last two years where virtually every home that came to market has found a buyer with relative ease. A new listing that previously had an 80% to 90% chance of selling in the first week now has a 10% to 20% chance of selling that quickly (example: there are 345 NSDCC active listings today, and there were 33 new pendings in the last 7 days), which means…..
Longer market times – with more unsold homes lying around, it gives buyers the impression that the ‘slowing market’ could mean lower prices are coming, which makes them more cautious. The longer a home is on the market, the more pressure is on the seller to do more improvements, or lower the price. Or they can also choose a third option and just wait in line and hope that they are moving slowly up into the group of 10% to 20% of active listings that have a chance of selling this week. This option is dependent upon the newest listings being more optimistic on price than those unsold currently, but because they have more recent data available on the perils of over-pricing, the newer listings should be sharper on price, not worse.
A slowing market means we have transitioned from the one-time-in-history event where every home sold quickly, to the old reliable sellers-waiting-in-the-queue, hoping for their lucky day to come.
With only 10% to 20% of the actives selling each week, it is inevitable that the unsolds will start stacking up as both sides wait longer for their lucky day. For some sellers, that day will never come, and they will cancel their listing instead.
Knowing that sellers will still insist on getting their price or close, how can buyers and sellers both know how close a home is to selling?
List-Price Accuracy Gauge
- If you are getting showings and offers, the list price is within 5% of being right.
- If you are getting showings but no offers, the list price is 5% to 10% wrong.
- If you aren’t getting showings, the list price is at least 10% wrong.
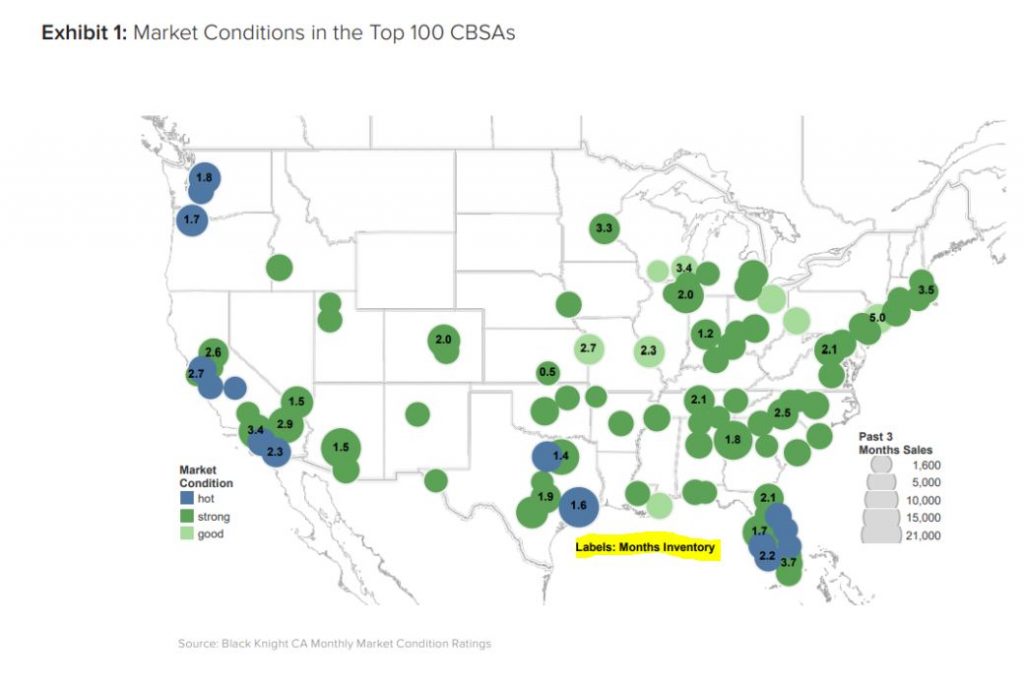
The best thing a seller can do is to lower their price so they at least get out of the bottom tier – you need to have showings to have a shot at selling. The market is still hot (see map at the top), there just aren’t as many active listings that are worthy of the attention of buyers. The sellers are still in control of the marketplace, and it will be their reaction to wrong pricing that determines the outcome – as measured by the sales count.
Back in the day (3-5 years ago), there were 10:1 actives to pendings in the high-end markets like Rancho Santa Fe, an area where sellers have always been content to wait as long as it takes. I’ll never forget the RSF listing agent who proudly asserted that her one-year anniversary of her listing was coming up! Some people don’t mind being on the open market and not selling – they are only motivated to move if they get their price, which is fine. Hope you get lucky!
Sellers will be hanging around for weeks or months, hoping the mythical market conditions improve and that lucky couple with 2.2 kids shows up, rather than go to work on their pricing. As their lease comes due or the start of school gets closer, the waiting buyers will anxiously decide whether they will step up and make an offer, or keep waiting for the mythical two-in-the-bush that might be a better value.
This is the Big Standoff whose intensity will be measured by the number of sales that find the sweet spot of being within +/- 5% of the latest pricing trend. The vast majority of sellers won’t sell for less, and buyers will be very reluctant to pay more than 5% above comps.
In the video above Byron and Nicole break down an article discussing a possible sales dip due to an anticipated retreat in demand. Article two is all about the current conflict in Europe and how it could affect the US housing market long term. Finally to round out the episode the pair go over 6 tips from Tom Toole on how to heat up chilly leads.
Updated: Boston Rea;l Estate Blog 2022
_____________________________________________________________________________________________________________________
Realtors express ‘caution but optimism’ about the housing market
In 2021, home sale profits rose in more than 90% of the country’s housing markets and reached the highest level since 2008.
Sellers of real estate making profits
Last year, a typical home sale brought sellers a profit of $94,092, up 45% from $64,931 in 2020 and an increase of 71% from 2019’s $55,000, according to ATTOM’s Year-End 2021 U.S. Home Sales Report. That $94,092 profit was a 45.3% return on investment when compared to the original purchase price.
The report also found raw profits and ROI improved nationally for 10 years in a row, and last year’s gain was the largest annual increase since 2013. The increase in profits came as the national median home price rose 16.9% last year to $301,000, setting another annual record.
Real Estate and low-interest rates
The spike in profits was driven by historically low interest rates, as well as buyers seeking to buy more space through the pandemic. A tight home supply drove up prices and thus seller profits.
“Households that escaped job losses from the pandemic dove into the market, in large part as a response to the crisis,” ATTOM chief product officer Todd Teta said in a release. “And the rising demand led the market boom onward. No doubt, there are warning signs that the surge could slow down this year. But 2021 will go down as one of the greatest years for sellers and one of the toughest for buyers.”
Last year also had the highest number of sales since 2005, with more than 5.7 million homes and condominiums trading hands.
The report found all but four of the 173 metros with populations of 200,000 or more had median price increases from 2020, and 124 had prices rise at least 10%. The largest year-over-year increases were in Worcester (39.6%), Barnstable (39.2%) and Boston (28.8%), Massachusetts; Boise, Idaho (27.2%); and Phoenix (26%).
The largest increases in areas with populations of at least one million were in Austin, Texas (25.4%), Nashville, Tenn. (22.2%), and Las Vegas (21.5%).
The report found 168 of the cities in the survey reached highs they hadn’t seen since the Great Recession, including New York, Chicago, Los Angeles, Dallas and Houston.
Median prices dropped in just four metros last year, but by single digits or less: Gulfport, Miss., with a 4.9% decline; Peoria, Ill., with a 1.8% drop; Beaumont, Texas, with a 1.4% decline; and Kansas City, Mo., where prices slipped 0.7%.
Homeownership tenure and cash sales
The report also found homeownership tenure fell to nearly a 10-year low. Those who sold their home in the last quarter of 2021 had only owned them an average of 6.14 years, down from 6.34 years in the previous quarter and 8.03 years in the last quarter of 2020. Lakeland, Fla.; Tucson, Ariz.;. Cleveland, Ohio; Knoxville, Tenn.; and Torrington, Conn.; had the lowest year-over-year declines.
Cash sales also hit a new high in 2021, accounting for 30.3% of sales — the highest level since 2015. Cash sales rose 22.8% in 2020 and 25% in 2019.
Realtors express ‘caution but optimism’ about the housing market
December 2021 Monthly Housing Market Trends Report
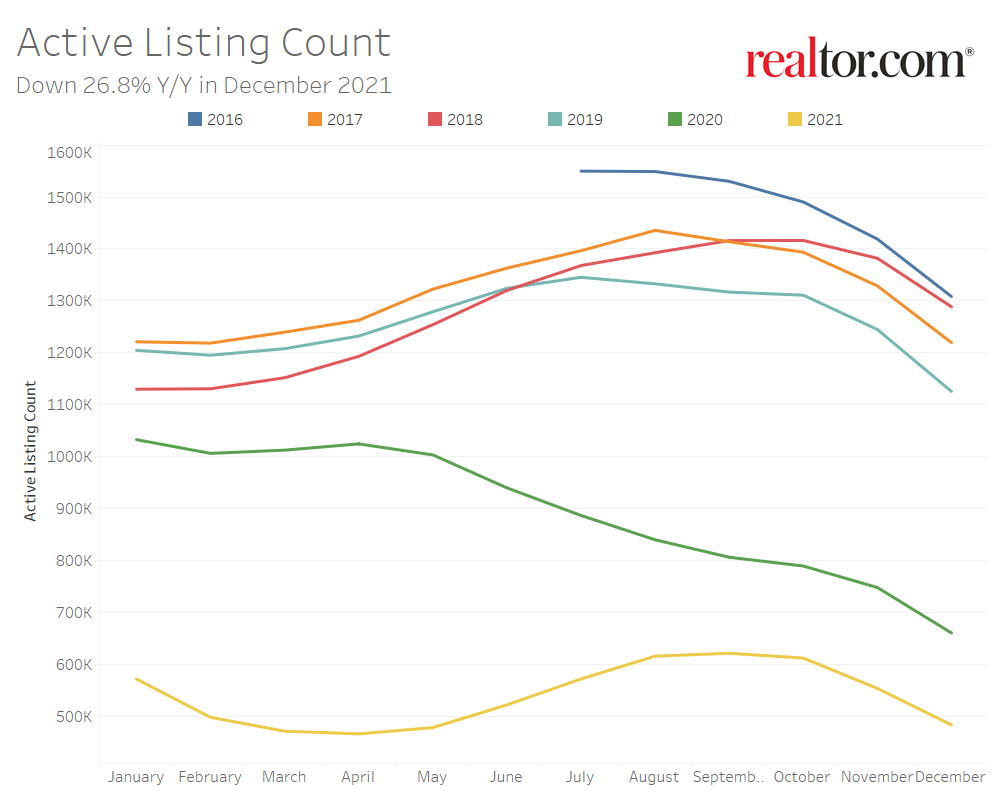
- The national inventory of active listings declined by 26.8% over last year, while the total inventory of unsold homes, including pending listings, declined by 16.1%. The inventory of active listings is down 57.1% compared to 2019.
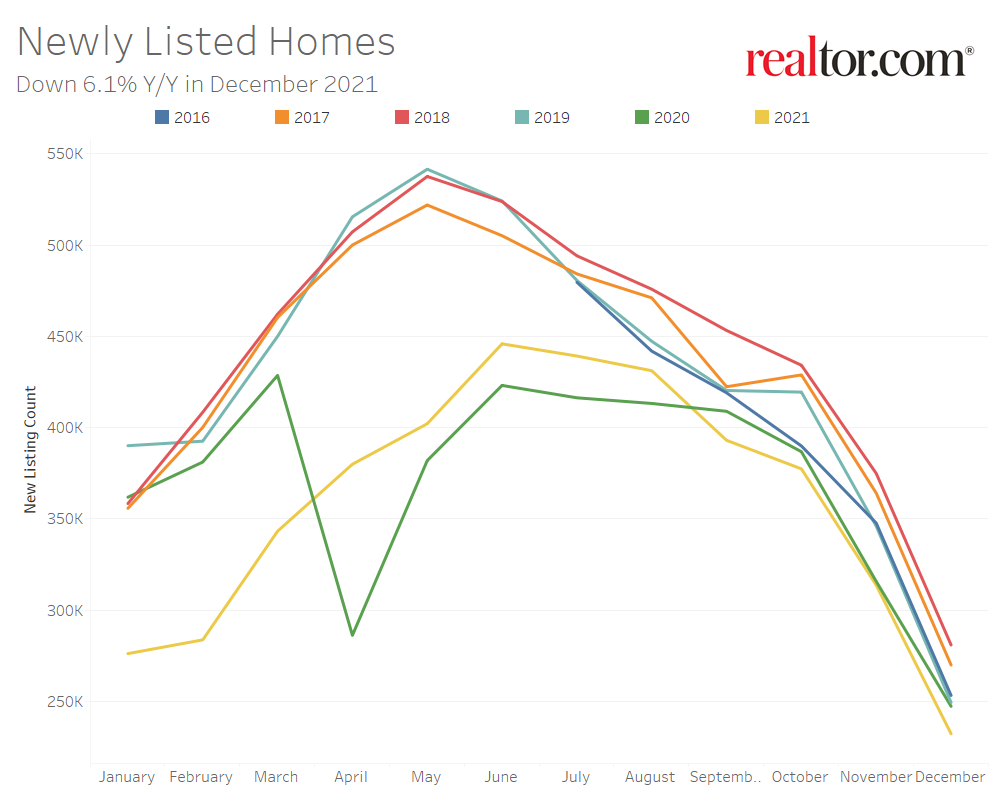
- Newly listed homes are down 6.1% nationally compared to a year ago, and down 7.6% for large metros over the past year. Sellers are still listing at rates 12.9% lower than typical 2017 to 2019 levels.
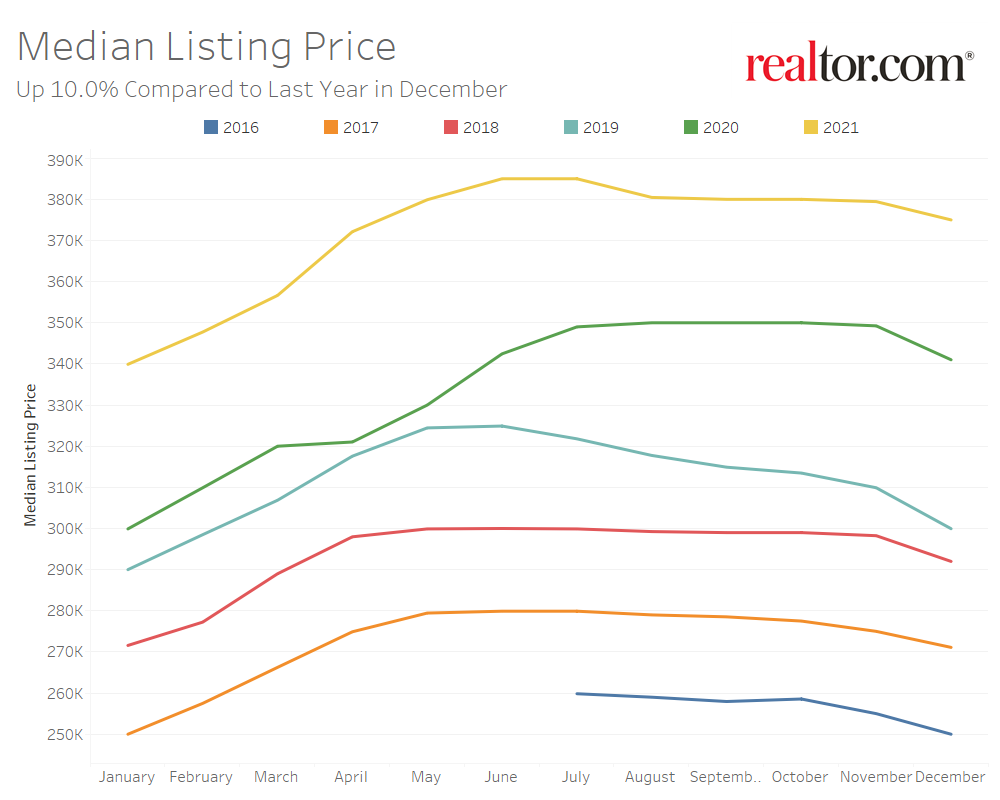
- The December national median listing price for active listings was $375,000, up 10.0% compared to last year and up 25.0% compared to 2019. In large metros, median listing prices grew by 5.4% compared to last year, on average.
- Nationally, the typical home spent 54 days on the market in December, down 11 days from the same time last year and down 26 days from 2019.
Realtor.com®’s December housing data release reveals a relatively warmer month (by housing market standards at least) than this fall, as looming interest rate hikes prompt buyers to lock-in rates in what is normally a slower time of year. The growth rate in the national median listing price increased in December, as did the gap in time on market compared to last year, as homes spent 11 days less on the market. The decline in inventory continued to intensify and price reductions- which had been growing in share compared to last year for the past four months- ended December at the same level as last year, indicating less need to slash prices to sell homes.
The Number of Homes for Sale Continues to Shrink
Nationally, the inventory of homes actively for sale in December decreased by 26.8% over the past year, a larger rate of decline compared to the 26.0% drop in November. This marks the third month in a row where the rate of decline compared to last year has worsened. This amounted to 177,000 fewer homes actively for sale on a typical day in December compared to the previous year. The total number of unsold homes nationwide—a metric that includes active listings and listings in various stages of the selling process that are not yet sold—is down 16.1% percent from December 2020. This is a minor improvement from last month’s 16.2% decline as the inventory share of listings in pending status increased slightly, a sign that buyers are active even with fewer, fast-moving options to choose from.
In December, newly listed homes decreased by 6.1% on a year-over-year basis and sellers were still listing at rates 12.9% lower than typical of 2017 to 2019 December levels. This marks the fourth straight month of lower new seller activity than last year which has contributed to lower inventory.
The inventory of homes actively for sale in the 50 largest U.S. metros overall decreased by 26.6% over last year in December, an increase in the rate of decline compared to last month’s 24.2% decrease. Regionally, the inventory of homes in large western and southern metros are showing the largest year-over-year decline (-32.1% and -20.0%, respectively) followed by the Northeast (-24.8%) and Midwest (-16.0%).
Markets which are seeing the largest year-over-year growth in newly listed homes include Memphis (+22.0%), Pittsburgh (+10.9%) and Philadelphia (+10.8%). Markets which are still seeing a decline in newly listed homes compared to last year include San Francisco (-27.6%), Hartford (-26.6%), and Raleigh (-24.1%).
Homes Sell 11 Days Faster Than Last Year
The typical home spent 54 days on the market this December, which is 11 days less than last year and 7 days more than last month as the housing market slowed for the holidays. Despite typical seasonal slowing, homes still sold more quickly than any other December in recent history and homes even sold more quickly than during summer seasonal peaks of pre-pandemic years.
In the 50 largest U.S. metros, the typical home spent 48 days on the market, and homes spent 7 days less on the market, on average, compared to last December. Among these 50 largest metros, the time a typical property spends on the market has decreased most in large metros in the South (-9 days), followed by the West (-6 days), Midwest (-5 days) and Northeast (-5 days).
Among larger metropolitan areas, homes saw the greatest yearly decline in time spent on market in Miami (-31 days), Orlando (-19 days), and Raleigh(-18 days). Only Hartford homes saw time on market increase, by just five days. However, time on market in Hartford is shorter than typical levels seen this time of year in 2019 and earlier.

Listing Price Growth Accelerates
The median national home price for active listings declined from $379,000 in November to a seasonal low of $375,000 in December. However, the median listing price grew by 10.0% year–over-year, an acceleration from the annual rate of 8.6% in November. This acceleration breaks the trend of 8 to 9 percent growth seen since August. Additionally, alternate price measures, which better account for a change in the mix of listings suggests that a larger number of smaller homes listed this year than last is dampening the rate of growth in the median listing price. The median listing price per square foot increased by 13.3% year-over-year in December. The median listing price for a typical 2,000 square-foot single family home rose 18.6% compared to last year.
The share of homes having their price reduced had been on the rise from August to November. In December, growth in the share of homes which have had their price reduced decelerated to just 0.1 percentage points from a higher growth rate of 2.0 percentage points in September, potentially signaling a shift in the trend of rising price reductions in the new year. In any case, the share of price reductions remains lower than typical 2016 to 2018 levels and this indicates the market is not yet cooling.

Active listing prices in the nation’s largest metros grew by an average of 5.4% compared to last year. Price growth in the nation’s largest metros has been lower than other areas across the country, but much of this can still be attributed to new inventory bringing relatively smaller homes to the market this year. The median listing price per square foot in the nation’s largest metros grew by 11.3% over the same period.
Las Vegas (+32.4%), Austin (+28.8%), and Tampa (+25.4%), posted the highest year-over-year median list price growth in December, while Austin also showed the greatest growth in the share of homes which had their price reduced compared to last year (+3.4 percentage points), followed by Pittsburgh (+3.2 percentage points) and Buffalo (+2.1 percentage points).
December 2021 Regional Statistics (50 Largest Metro Combined Average)
| Region | Active Listing Count YoY | New Listing Count YoY | Median Listing Price YoY | Median Listing Price Per SF YoY | Median Days on Market Y-Y | Price Reduced Share Y-Y |
| Midwest | -16.0% | -4.2% | -2.8% | 6.7% | -5 days | -0.8% |
| Northeast | -24.8% | -6.9% | 0.7% | 8.3% | -5 days | -0.2% |
| South | -30.0% | -6.8% | 10.1% | 15.8% | -9 days | -0.9% |
| West | -32.1% | -13.1% | 8.3% | 9.8% | -6 days | -0.5% |
December 2021 Housing Overview by Top 50 Largest Metros
| Metro | Median Listing Price | Median Listing Price YoY | Active Listing Count YoY | New Listing Count YoY | Median Days on Market | Median Days on Market Y-Y | Price Reduced Share | Price Reduced Share Y-Y |
| Atlanta-Sandy Springs-Roswell, Ga. | $390,000 | 9.9% | -20.3% | 0.3% | 43 | -10 | 13.8% | 1.4% |
| Austin-Round Rock, Texas | $544,000 | 28.8% | -10.4% | 1.6% | 42 | -14 | 14.9% | 3.4% |
| Baltimore-Columbia-Towson, Md. | $311,000 | -4.2% | -12.5% | -2.0% | 50 | -4 | 17.5% | 1.0% |
| Birmingham-Hoover, Ala. | $272,000 | 4.3% | -31.3% | -7.2% | 53 | -10 | 12.8% | -1.8% |
| Boston-Cambridge-Newton, Mass.-N.H. | $695,000 | 7.0% | -32.3% | -13.4% | 52 | -8 | 9.8% | -2.0% |
Boston Condos for Sale and Apartment Rentals
This content is currently unavailable. Please check back later or contact the site's support team for more information. Boston condos[/caption]
From the Fed’s latest Beige Book report, with our bold emphasis added:
Realtors in the First District express caution but optimism about the mixed sales results that continued in the region in February. Year-over-year sales of single family homes decreased in Rhode Island, Massachusetts, and Connecticut, and increased in Maine and Vermont. (Contacts in New Hampshire were unavailable for comment in this round.) In the condominium market, sales increased relative to last year in Connecticut, Massachusetts, and Vermont, while decreasing in Rhode Island; condo sales information is not reported in Maine. The consensus across the First District is that the decline in sales will be short lived; respondents say it was partially driven by the tough winter, as well as uncertainty about new federal flood insurance rules. Signs of spring weather and new legislation limiting flood insurance premium increases are lessening these concerns. In Massachusetts, however, inventory shortages are said to be the key reason for the decline in sales. One Massachusetts contact stated “there is just not enough supply to meet demand.” As a result, Massachusetts contacts say multiple bids are common and the median sales price for single family homes has increased compared to the year-earlier median in 17 consecutive months. Median sales prices also increased year-over-year in Connecticut and Maine, but declined in Vermont and Rhode Island. Residential real estate contacts say they expect sales to pick up seasonally this spring, but foresee no significant market shifts.
Back to Boston condos for sale homepage
Contact me to find out more about this property or to set up an appointment to see it.
Boston condos
Boston condos for sale
SEARCH FOR CONDOS FOR SALE AND RENTALS
For more information please contact one of our on-call agents at 617-595-3712.
Buying a Beacon Hill condo for sale
Tips on buying a Beacon Hill condo
Boston Beacon Hill condo buyers how to beat all cash offers
5 tips on buying a Beacon Hill condo for sale
Benefits of buying a Beacon Hill condo
Design tips for Beacon Hill condo buyers
Boston Beacon Hill condos for sale 5 must know terms
The difference between a Beacon Hill condos and a Beacon Hill loft
Common mistakes when buying a Beacon Hill condo
Buying a Beacon Hill condo with kids
Is it time to ditch my Beacon Hill condo agent?
Beacon Hill condos for sale: Do I need 20% down?
3 signs you’re going to buy a Boston Beacon Hill condo
6 principles to know when buying a Beacon Hill condo
How to select a Boston Beacon Hill condo agent
Boston Beacon Hill condos for sale downpayment
Boston Beacon Hill condos finance
Beacon Hill condos for sale what is negotiable
Beacon Hill condos for sale: What it take to get a mortgage.
Boston Beacon Hill condos for sale. Understand the condo association
How much do Boston Beacon Hill condos cost?
Boston condos for sale near Downtown/Midtown Boston
Back Bay Boston condos
Beacon Hill Boston condos
Charlestown Boston condos
Navy Yard Charlestown Boston condos
Dorchester Boston condos
Fenway Boston condos
Jamaica Plain Boston condos
Leather District Boston condos
Midtown Boston condos
Seaport District Boston condos
South Boston new condos
South End new condos
Waterfront new condos
North End new condos
West End new condos
East Boston condosCondos around the Midtown area to rent:
Back Bay area condos for rent
Beacon Hill area condos for rent
Charlestown area condos for rent
Navy Yard Charlestown area condos for rent
Dorchester area condos for rent
Fenway area condos for rent
Jamaica Plain area condos for rent
Leather District area condos for rent
Midtown area condos for rent
Seaport District area condos for rent
South Boston area condos for rent
South End area condos for rent
Waterfront area condos for rent
North End area condos for rent
West End area condos for rent
East Boston area condos for rentClick here: Boston Midtown Condos For Sale.
Boston condos for saleClick Here to view: Google Ford Realty Inc Reviews
Click to View Google Reviews
Click Here to view: Google Ford Realty Inc Reviews


